加载中...
共找到 37,673 条相关资讯
Adam Castleton: Good morning. Thank you for joining LSL's Interim Results Presentation. I'm Adam Castleton, LSL's Group CEO, and I'm here with David Wolffe, Interim Group CFO. I'll first cover highlights, market context and progress we've made in our divisions. David will then take you through a financial review. I'll then talk about outlook and some key takeaways, and we'll take questions at the end. We're recording this event and a replay will be available on the LSL IR website. These are my maiden set of results as Group CEO. I'm really pleased to report the results are in line with expectations, and we continue to make good operational progress. Revenue and profit are up with operating margin maintained at a 15-year high. Return on capital employed of 31% for the last 12 months is much higher than historical levels. These reflect the improvements we've achieved following the transformation of the group in recent years, and this was achieved while continuing to invest for growth. This performance underlines that our capital-light resilient model is delivering consistently while we are reinvesting for the future and the full year outlook remains unchanged. Moving to key financial highlights. Group revenue increased by 5% to GBP 89.7 million, and we maintained our strong market share. Group underlying operating profit was up 3% to GBP 14.8 million, while we continue to invest strategically in our business and absorb the national insurance increase. We are a highly cash-generative business. Our cash conversion for the last 12 months was 95%. This is at the upper end of our target range of 75% to 100%. We performed well in a recovering market. Total mortgage lending in the market increased by 5% with a very different picture in new lending, which was up 22%, whilst product transfers rebalanced back 10% year-on-year. We gained market share with our new mortgage lending up 23%. U.K. residential sales were up 17% with a pull forward of demand given the stamp duty changes. We maintained our market share of this market. Mortgage approvals increased 10%, with the change in our lender mix slightly reducing our estimated share in surveying and valuations with revenue up 9%. We operate 3 divisions with leading market positions, each benefit from strong long-standing client relationships with scale and strength in their markets as well as expertise and deep domain knowledge. Each delivered operational progress during the period. In Surveying & Valuation, productivity per surveyor increased by 8%. B2C revenue increased by 43%, and we renewed a top 5 lender contract and started working with another new lender. In Financial Services, new mortgage lending was up 23%. Revenue per adviser increased by 8% and the implementation of the new CRM is progressing well. In our Estate Agency Franchising division, we increased the size of our lettings portfolio, making 3 acquisitions during the period with a strong pipeline, and we added 3 new branches to our franchise network. In summary, each division continues to execute well while maintaining discipline on margins and returns. I'll now hand over to David to take you through the financial review in more detail. David Wolffe: Thank you, Adam. Good morning. I'm David Wolffe, Interim CFO at LSL, previously CFO at a number of high-growth, tech-driven and listed businesses. Let's look at the group's financial performance in more detail. In the half year, revenue grew 5% to GBP 89.7 million, driven by 9% growth in our largest division, Surveying & Valuation. Underlying operating profit increased to GBP 14.8 million, up 3% year-on-year, and I'll come back to that increase in just a moment. Operating margin remained strong at 17% at the upper end of our historical range. Cash from operations at GBP 7.4 million reflects shareholder distributions, planned investment and some working capital timing. Again, more on that shortly. Return on capital employed for the last 12 months increased to 31%, very strong compared to historical levels. So the first half has delivered continuing growth while maintaining a high return on capital profile. Coming back to that operating profit increase, there are 2 main points to highlight. First, we have made positive operating performance progress with an underlying increase of GBP 3 million before strategic and investment decisions. This progress is driven by our volume growth across the business, improved pricing and the first positive contribution from the Pivotal Joint Venture. Second, we made strategic decisions in 2 areas, which reduced profit in the period. We stepped away from some protection-only business as we rebalanced our adviser firms towards mortgage and protection or composite firms, and we made investment across Financial Services and Surveying to drive future growth. So the headline growth of 3% is a combination of that underlying progress and the growth investment. Turning now to cash flow and capital allocation. In the half, we delivered positive operating cash flow of GBP 7.4 million after working capital movements around the 2024 year-end. I'll come back to this in just a moment. We deployed capital in 2 key areas in the period. First, in shareholder returns, we distributed GBP 9 million in dividends and share buybacks. The interim dividend is maintained at 4.0p, and the buyback program continues with GBP 3 million deployed to date. Second, in strategic investment, GBP 3.6 million of cash was spent across CRM development, data and lettings books acquisitions to drive future growth. Our balance sheet remains robust. With June cash at GBP 22 million and a GBP 60 million unutilized facility, we have strong liquidity and our capital-light model ensures ongoing flexibility. Looking at the positive operating cash flow and working capital in a bit more detail now. The line at the bottom of this slide shows our adjusted cash from operations performance over the last few half periods. The GBP 7.4 million we reported in H1 presents as a lower number than last year, but we had a timing effect of GBP 4 million excess working capital inflow just before the 2024 year-end that then unwound into an outflow into 2025. You can see this in the lines above. In operating profit, we have stable progression. Depreciation is flat and low, reflecting our capital-light operating model. Cash on lease liabilities continues to moderate after the transformation of the Estate Agency business. But on working capital, H2 2024 inflow of GBP 5.9 million you'll see in the box was an outlier, which illustrates these timing effects around the year-end. The unwind in H1 of 2025 makes our cash conversion look suppressed in the half, even though on a rolling 12 months basis, we made really good progress. We expect that the second half and full year 2025 cash conversion should be normalizing towards our target of 75% to 100%. Taking each division in turn, let's run through the story of the half. In Surveying & Valuation, revenue grew 9% to GBP 53.2 million, within which B2C was up 43%. Underlying operating profit was GBP 11.9 million, with margins at 22%. This is down on the elevated levels of H1 last year with Surveyor commissions now normalized, and this effect is in line with what we have flagged before. But in sequential performance compared to the second half of 2024, we have made good margin progress, up 200 basis points. Volumes grew with jobs up 7%. Fee per job was up 2% with better terms and more B2C activity, and we improved Surveyor productivity in jobs per surveyor, which was up 8%. In Financial Services, revenue was flat overall, but this illustrates the combination of mortgage-related revenue up 21% and protection revenue down 12%, following our strategic repositioning away from protection-only brokers. As a result, adviser numbers were down to 2,637, but adviser productivity increased 8% in completions per adviser, and we grew fee per completion by 3%. But overall, at a divisional level, despite the broker repositioning and some P&L investment in CRM, operating profit grew 23% to GBP 4.8 million, with Pivotal making that positive contribution. In Estate Agency Franchising, revenue overall grew 1%, but while residential sales revenue was up 24% and lettings revenue up 4%, our land and new homes business was pushed back by a contract change. As a result, underlying operating profit margin remained flat at 24%. We are expecting improvement in the second half with cost savings feeding through. Branches grew by 1% after 3 more openings in the half, with overall sales income per branch up 22%. The lettings portfolio now stands at over 37,400 properties after 7 lettings books acquisitions since mid-2024, with overall income per property now up 1%. So with progress in each of the divisions, the group delivered on expectations in the first half, whilst at the same time, positioning itself for stronger growth in the second half of the year. And with that, I'll hand you back to Adam to take you through the outlook. Adam Castleton: Thank you, David. Expectations for the full year remain unchanged. In the second half, we expect a sequential step-up in profit in each division with an increase in refinancing activity, a strong activity in 2-year and 5-year mortgages in 2020 and 2023 mature in large numbers. We've already seen this in July and August, with July the strongest refinancing month for us this year. We also came into the half with residential sales pipelines increased from this time last year. We will continue to invest in our business in the second half, for example, in lettings books and the FS CRM system. Indeed, in September, we've already completed a further 3 lettings books. When I presented our preliminary results back in April, just before I started out as Group CEO, I set out my early thoughts and priorities. These remain unchanged, and I'm pleased with early progress. Our senior leadership teams are responding well and are raising their sights and ambitions even higher for the future. We continue our investments in technology and data, notably the new CRM in FS and data in Surveying & Valuations, whilst we are also trialing new AI-enabled solutions to improve productivity. I'm already working closely with our divisional business leaders on the opportunity to leverage group strengths, and I'm encouraged by the early signs that I'm seeing. I'm working very hard and even more transparent and clear communication, both internally and to the market. For example, we've just rolled out the first wave of updates to our IR website, adding some fresh new elements to allow greater accessibility and transparency. This is all steady, deliberate progress, and I look forward to sharing news of our ongoing progress. We are a diversified, resilient cash-generative group, strategically positioned for growth. We're delivering, performing in line with expectations, and we're investing carefully while maintaining shareholder distributions. We're building consistently. The LSL of today is stronger and leaner, delivering higher-quality earnings. It is early days in my tenure as CEO, and I'm excited about the growth opportunities open to us as a group. With 2025 on track, we're looking ahead with renewed ambition and with confidence about our future. With that, operator, can we please move to Q&A. Operator: Thank you. [Operator Instructions] There appears to be no questions at this time. So I'd like to hand the call back over for questions via the webcast. Unknown Executive: Okay. Thank you. We've got a number of questions on the webcast. I'll ask them one at a time. The first question is from Glynis at Jefferies. Glynis asks about the Surveying division and the year-on-year movement in the operating margin. You talked about this as -- in the second half of 2024, you're talking about it again today. How should people think about the first half 2025 margin? And what sort of level is considered normal? Adam Castleton: Yes. Thank you, Glynis. Thank you for your question. So last year, as we flagged at the interims and the prelims, we had enhanced margins in the first half of last year as we came into the year in 2024. We had a burst of activity, and we didn't bring back the surveyor incentives immediately. And secondly, there were some administrative heads that we didn't bring back immediately as well. Therefore, there was quite an enhanced margin for the first half of, I think it was 25%, sequentially then that fell in H2 and has now recovered to about 21%, 22%. We expect that really to be the norm. So at the moment, 21%, 22% is really the norm for our margin going forward, the 25% was elevated in the very top end of what we might normally expect to see. Unknown Executive: Great. Thank you, Adam. The second question comes from Jonathan, who's at Edison. Jonathan asks about the impact of changes in stamp duty. Have you seen any material changes in demand in the month since the stamp duty changes came into effect? Adam Castleton: Yes. Thank you. Thank you for your question. Yes, there was a spike, particularly in March with the stamp duty changes. So we saw for the whole half, 17% up for the overall market, which we tracked. March was particularly strong. It was actually 170,000 transactions in the market for that month. What we've seen since then is a good market as we expected. In fact, because H1 2024 was a bit softer, the 17% looks very high. But in fact, the second half of this year will be a little bit more in transactions than it was in the first half. So we see sequential rises, notwithstanding the spike. So certainly, if the question is which -- from time to time, people have asked whether somehow there was a spike and then it sort of hollowed everything out, it certainly didn't. We entered this half year with increased pipelines, which is great. As I said, we expect residential sales to be a little bit more in the second half than it was in the first half, notwithstanding the spike duty spike. Unknown Executive: Great. Thanks, Adam. We have a follow-up question or a second question rather, sorry, from Glynis at Jefferies. There's been a lot of talk in recent weeks about potential government policy changes. How has this impacted your business in recent weeks? And if some of the changes that are being speculated in the press were put into place, what are the implications for the group? Adam Castleton: Thank you again, Glynis, for the question. Obviously, something that we're all reading in the newspapers. The autumn budget is obviously a couple of months away in November, and we read, as you do, Glynis, all the various either ideas or kites that are being flown, it's hard to tell which they are. I don't think I'll comment on speculating what may not come through and what that might mean. Obviously, as a business, we stay very close to what will happen, what we focus on are the facts that we have at hand and as a business that covers the whole range of services in the property and lending markets, we've got really deep knowledge and deep data. So if we look at all the information that we have across Surveying Financial Services and Estate Agency covering mortgage applications, completions, fall-throughs, which are when agreed sales fall through sometimes because the chain has fallen through because people pull out. We're seeing nothing of any of our metrics and -- because I expected some of these questions rather than checking these numbers once a day, I'm checking them twice a day with people and ringing people up. We're not seeing anything at the moment. Whether there's a question of sentiment, I can't say, but certainly, all of our metrics are showing no change of customer behavior. And I think depending on what does or doesn't transpire in the budget, as we've demonstrated over many, many years, we're a dynamic business. We're very quick to react and to change the market. We're well positioned for that. And for any negative shocks that comes to the market in the future, of course, following our franchising restructure, we're a lot more even in our earnings, less volatile. And so we're certainly less spiky. And we're very, very quick to react. And as I said, the data that we have is very, very specific. Just as a little example, when our friends across the water introduced the tariffs, I made a call and said, could they pull out fall-through data from Solihull, which is where the Land Rover factory is and in the Northeast where the Toyota factory is just in case people felt nervous because of the tariffs. So we really stay on top of data closely. And whilst I can't tell what may happen tomorrow or the day after in the budget, certainly, everything we've seen demonstrating that the customer behavior is unchanged and in line with what our expectations are. Unknown Executive: Great. We're actually going to move back to the conference call. We've had a question on the conference call, and then I've got another 2 questions on the web platform. Operator: And we take a question from Robert Sanders from Shore Capital. Robert Sanders: Just I suppose following on from that question about the government and sort of the other aspect of the market that's been a bit open to surveys has been the lettings market and [indiscernible] whatever saying that there's a downturn. Is that something that you're experiencing? And what do you think the outlook is going to be for the lettings market given renters rights [indiscernible] as we move into the next year? And then as a follow-on question, can I also ask you about what your -- you talked about the technology and data innovation and what you're seeing as the opportunities, particularly in the Surveying & Valuation division for the use of AI? Adam Castleton: Certainly, yes. Thank you. Thanks very much. Good question about the lettings market. The first thing I'll say is the lettings market is extremely resilient. If you actually look at the number of privately rented dwellings in the country, it's been very stable at GBP 5.4 million, GBP 5.5 million for the last few years, so we've seen no change of that. From our perspective, we have slightly increased our lettings portfolio, as David said, to over 37,000. And actually, as legislation, you mentioned the renters rights becomes a bit tighter. What we're seeing is that there's more interest from landlords who are self-managing to move towards a managed service. And we're starting to see that movement and that interest and we're certainly marketing to those landlords. It's interesting, you mentioned some of the metrics and the headlines that we see that forecast problems for the lettings market. I would just say that if you note some of those metrics, they don't necessarily show what they may appear to on the face of it. The first thing is there's been some publicity about lettings instructions being down, which is actually something we've seen over a number of years. One of the main reasons for that is that people are staying in their properties for longer, and therefore, there are less instructions than historically they were. Landlords will keep a good paying regular tenant and tenants will -- with everything going on in the market, will prefer to stay where they are. So that's certainly the reason -- one of the main reasons that instructions are down. It's not demonstrating that things are leaving the market. And also, we hear metrics quoted around there being more properties for sale that were previously rented. And whilst that might be the case, of course, those rental properties are often bought by other buy-to-let landlords. So certainly, we don't see a big change in the numbers of properties rented. We see opportunities for further growth. As David said, since the middle of '24, we've done to the end of the period 7. And actually, we did 3 lettings books during the half. And since the end of the half, actually in September, we've done 3 and just about to close to 4. So we see some good opportunities there. It's certainly not buoyant as it was when originally buy-to-let really grew quite strongly, but we're seeing no material change in the numbers of properties, dwellings that are privately let. In terms of the renters rights, as you mentioned, and as I say, just to reiterate, a, we don't see that changing materially the structure of the market. As I said, it may certainly lead to an opportunity for us to bring landlords who are currently self-managing over to a managed service. And that's probably a general point to make around regulation and regulatory changes. As a larger player, we're well placed to make the investments required to cover any changes necessary. And obviously, our deep relationships with whether it be our franchisees or our financial services, we're able to give our sort of trusted advices we have for many, many years. Unknown Executive: I've got 2 questions here from Robin from Zeus. Again, I'll ask them one at a time. In terms of the first question, could you please provide some more detail on Pivotal Growth in terms of current run rate of advisers, revenue, trading performance? Adam Castleton: Yes, Pivotals -- the Pivotal investments is scaling very well in terms of EBITDA, which is the actual entity results in the first half, that was -- again, these are within the interims, these are about GBP 3 million, GBP 4 million of EBITDA. So on a decent run rate for the year. So it's scaling up well. There were 2 small acquisitions during the half that we announced in the interims. And actually, in the post balance sheet note, you'll see that there was one further acquisition that completed after the end of the period. So scaling up nicely with over 500 advisers, the EBITDA run rate is going well. We're looking forward to continued growth and eventual realization of our investments. Certainly, we expect that to be well over our return on our weighted average cost of capital. Unknown Executive: Great. Thanks, Adam. And then there's a second question from Robin also about Pivotal growth. So Robin's question is, can you please expand on your reference about LSL being founded 21 years ago and it's being built on -- success being built on operational resilience, opportunistic dealmaking and entrepreneurial culture. What are LSL's strengths? And how does Pivotal fit into these strengths? Adam Castleton: Okay. That's okay, interesting. So yes, I mean, I won't repeat the words, but the business has -- it's quite entrepreneurial. It's very agile and it's very dynamic. We're very quick to move and to take opportunities. One of the examples actually I often use is when the pandemic hit at the same time that we were planning for the worst case for a year where we would have no business, we were also planning for the state agency to open immediately, and we're planning for both. And in the end, we really, really farmed the market well as it recovers. So very, very quick, and we're always agile. The opportunity -- the opportunistic element of Pivotal when it was founded was for a buy and build within the broking business, which exists in many other industries as we know, and there's an opportunity for us in the broking business, which we have launched. So really, it is an opportunistic approach to buy and build within a sector that had not seen it before. And so far, we're pleased with the scaling. And as I said, we expect a realization of our investments in due course. Unknown Executive: Great. That's all the questions covered on the web platform. No further questions. That's it. Back to you, Adam, for closing remarks. Adam Castleton: Listen, thank you for all the questions. I apologize for my colleague, David. They've all been pointed at me and I've answered them all. So I'm sorry that your -- all your numbers are not... David Wolffe: [indiscernible] Adam Castleton: Thank you very much. So listen, thank you for the questions. We're really excited about the opportunities ahead for the group. We're available for any follow-up that you may need. And I thank you all for your questions, your interest, and I look forward to carrying on the dialogue with you. Thank you.
Operator: Ladies and gentlemen, thank you for standing by. I am your Jota, your Chorus Call operator. Welcome, and thank you for joining Allegro Group Earnings Call and Live Webcast to present and discuss the second quarter 2025 results. [Operator Instructions] The conference is being recorded. [Operator Instructions] At this time, I would like to turn the conference over to Mr. Tomasz Pozniak, Investor Relations Director. Mr. Pozniak, you may now proceed. Tomasz Pozniak: Thank you, Jota, and welcome to all participants of our call. Let me introduce the presenters of today. Marcin Kusmierz, the CEO of Allegro Group, who will provide you with the highlights of Allegro performance in Q2 and summarize the key takeaways; and Mr. Jon Eastick, our CFO, who will guide you through the financials for Q2 and update of the outlook for the full year 2025. As usual, our results presentation is available for download from our Investors web page at allegro.eu. You may also download the slides from the link available on the webcast screen. As a reminder, today's presentation and discussion contains forward-looking statements. Our actual results could differ materially from the expectations expressed in such statements. Please make sure you review the full disclaimer on Slide #2. Also please note this presentation and the Q&A session are being recorded and will be available for a replay on our website at allegro.eu. And with this, I would like to hand over to our CEO, Marcin. The floor is yours. Marcin Kusmierz: Good morning. This is Marcin Kusmierz, CEO of the company. Thank you for introducing and welcoming the participants of today's conference call. At the beginning of our meeting, I would like to share the key financial and operating results achieved in the second quarter of 2025. Detailed information will be presented by Jon Eastick, our CFO, in the second part of the presentation. GMV on Allegro in Poland was close to 10% and more than twice as high than nominal growth in retail sales. We showed rapid growth compared to our competitors in the e-commerce industry as well as traditional retail chains. We exceeded 15 million active buyers, while also passed PLN 4,000 GMV per active buyer. Good results in GMV and increase in the number of buyers resulted in strong revenue growth over 18% year-on-year. Almost every part of our business developed well, but our advertising business line deserves special mention with over 30% growth year-over-year. It is also worth mentioning the take rate, which exceeded 13% in Poland and improved by nearly 5 percentage points. We see that we still have very good potential for further growth in Poland. For customers in Poland, Allegro is the first choice, and we are consistently building our position in the Central Eastern Europe. At the group level, GMV increased by 9%, which was influenced by continued optimization of the mall group. At the level of international marketplaces in CEE, we achieved excellent GMV growth and demonstrated Allegro's consistency in building a strong position as a regional leader. The number of active buyers in the group exceeded 21 million with GMV per active buyer increasing by over 4%. At the group level, our revenues grew by over 10%, again, with a good outlook for the future. Strong GMV growth and excellent revenue growth had a positive impact on adjusted EBITDA, which increased by 14% in Poland and by over 20% at the group level. Thanks to that, we are upgrading revenues and adjusted EBITDA outlook towards the top end of the range. We are constantly continuing our investments related to the development of the marketplace's functionality and making it even more attractive. We're also investing in the development of logistics infrastructure that supports the expansion of the Allegro delivery program. As a result, our CapEx expenses increased by 67% to over PLN 200 million. It's also worth mentioning the reduction in financial leverage, which was supported by strong free cash flow generation. Let me now present the 4 pillars of our development. These are the strategic directions, which we focused last couple of years. We are constantly investing in the development of the marketplace, our core business in both Poland and the CEE region, giving consumers the widest choice of products, ease of purchase and range of added services. We're also developing new growth drivers, which, on the one hand, strengthened our core business and on the other hand, build a long-term competitive advantage. They have a positive impact on the pace of our business development and make our business more diversified. I'm talking about advertising, financial services and logistics. With each quarter, we are growing stronger in the markets of Central Eastern Europe. Customers from Czechia, Slovakia and Hungary are increasingly shopping on Allegro, building relationships with us and taking advantage of our loyalty program. They increasingly treat us as one of the main places to buy products based on our wide selection and attractive prices. We want to continuously improve our value proposition for buyers and sellers in the region so that as in Poland, we are their first choice. We're also strengthening our foundations, technological business and human. We use a modern technological platform within the group, and we are building a culture focused on innovation and development. We are a company that invests in long-term growth and strengthening our market position. For a moment, I will focus on the value proposition we offer to buyers and sellers in Poland. We invest heavily in personalization and targeting products to the expectations of consumers and business customers. Allegro is a place where you can find the widest range high-quality branded products. We're constantly attracting new sellers to the platform. They represent almost all industries and business sizes. They are global corporations as well as local microenterprises and have perfect understanding of customer expectations and needs. When I joined Allegro a couple of months ago, we almost immediately started a discussion with the management team and the Board about the possibility of accelerating our growth and strengthening our market position. Allegro has almost everything it needs to conquer new market segments and attract new customer groups. It is the leading online shopping destination in Poland, and we see further prospects for strengthening our position. So we are analyzing the market and the attractiveness of investment in its individual segments. In the coming weeks or months, we will discuss and approve strategic areas for making potential investments with the Board. We have launched the process that we're calling accelerated evolution. Our ambition is to be the leading shopping destination for current customers and customers representing future generations. We want to be a platform that addresses customer expectations and needs and is a friendly ecosystem that supports the growth of our partners. Let's start by discussing the core marketplace and how we see opportunities for its growth in the future. We will certainly accelerate investments in the development of marketplace functionality. For 25 years, Allegro has been the first choice for buyers and sellers in Poland and Central Eastern Europe. We see potential in combining the functionality and added services of the 3P and 1P models, everything that is the best about that. The 3P model remains our foundation, and we do not plan to expand our own product range or maintain larger inventories. What inspires us in 1P and what we add to Allegro is sector expertise, consulting and even better product management. Now I will focus on the possibility of expanding our marketplace with new categories and market segments. The natural direction for the development of marketplace is expansion of product offering. We currently have over 80 million products, but we still see opportunities to add some new product categories, accelerate GMV growth and increase the frequency of purchases. We're also exploring possibility of cooperating with brands that they are not currently present in Poland and CEE to become a gateway for their market expansion. Services, a new area of interest for us. We're analyzing and looking with curiosity at the rapidly growing services segment in recent years. We're carefully looking at the segments with the largest market share and the greatest potential, both those that support the sales of products, financial services or insurance as well as those that are independent. Customers trust Allegro. They have great relationships with us, and they want to grow with us. So we believe that we will be able to create for them some new special unique value. The next point is potential externalization of services produced at Allegro as another area that could potentially support our growth. We're considering selling some services outside the marketplace. We create world-class products and following the example of global players, we're thinking about selling them in other parts of the market. Our Allegro Pay is the best buy now, pay later solution on the market. Our logistics infrastructure is the engine for the highest quality services. This is a potential opportunity to build relationships with the new groups of customers and sellers. We see a lot of interest and demand from merchants. We're talking with them about joint opportunities for growth, business development and new directions for expansion. Finally, our goal is to update our value proposition so that customers continue to see its uniqueness and fully appreciate its value. For clarity, I want to underline that presented directions of development are fully consistent with the current strategy and are still the subject of our analysis and consultations with the Board. We're constantly investing in improving our value proposition for buyers and sellers. In the first half of the year, we developed a shop-in-shop service combining the shopping experience known from 3P and 1P models. The solution has been recognized by regional and international brands such as Finish, HP, Inglot, Karcher or Pampers. The number of authorized sellers representing well-known brands has also increased significantly. Now we have over 3,000 of them on Allegro. Thanks to better management of AML and KYC processes by Allegro Finance, we have improved the merchant verification process. As a result, new merchants can start selling on Allegro much faster. As part of the partner channel, we're working with merchants to further simplify processes. Our ambition is to have the most merchant-friendly ecosystem among European marketplaces. Over 1.5 million products in Poland and nearly 0.5 million in Czechia are covered by the best price guarantee. This is further confirmation for customers that Allegro is the best shopping destination. With us, they can save some money and time. And it is also worth mentioning the prestigious awards we received in the second quarter, Brand of the Year, Best Marketplace and the Best Shopping Experience. Smart! is one of the leading loyalty programs in Europe. We have added new benefits to it and to activate and reward its users. The program now has many new additional features, fun and gamification, unique deals and benefits to be used on Allegro, but also outside the platform. Smart! is extremely popular and attracts hundreds of thousands of new users every year. They also have access to unique events and promotional campaigns. In Poland alone, they are already over 6 million subscribers. We are happy to announce that Allegro Delivery has become the program serving the largest number of parcel lockers in Poland. Thanks to the new agreement with DPD announced in recent days, their number within Allegro Delivery has exceeded 33,000 and the number of pickup points has exceeded 37,000. Thanks to the close cooperation with DHL, DPD, Orlen Paczka and of course, Allegro, buyers and sellers have even more choice in both delivery methods and locations. It is worth remembering that consumers always decide how they want their parcels to be delivered and they use Allegro app to track their shipments. Buyers on Allegro also have access to logistics services provided by other companies. By developing the Allegro Delivery program and our infrastructure, we are increasing the efficiency of our logistics services and our independence from selected service providers. By the end of the year, we want to have over 8,000 of our own parcel lockers, over 1,000 more than we originally planned. It is worth mentioning that thanks to successful negotiations with manufacturers, the installation of a larger number of parcel lockers will take place within the approved CapEx. We have also decided to invest in new depots and completing new sorting facility. This is associated with rapid increase in managed volume, which exceeded 34% at the end of Q2 and increased by nearly 5 percentage points compared to the previous quarter. We're also achieving one of the highest NPS results in the industry, which amounted to 82 points in the second quarter. We are already seeing the positive impact of the cooperation with DHL, which began a couple of months ago, and we expect at least the same effect from the new cooperation with DPD. Let's move on to my favorite slide because it's related to AI technology. Our company is certainly one of the leaders in AI-based technological transformation. We do massive implementation in the company, which will cover almost all parts of the organization. We're talking about areas related to purchasing such as intelligent search engines or recommendations, increasing productivity in software development and equipping our employees with new skills to improve their work efficiency. We believe in this technology. We have already implemented it commercially based on an agentic approach in marketing or customer experience or customer service, and we are convinced that AI is an investment with a high rate of return. We are constantly increasing the use of AI technology in our current and planned projects. We expect that next year, around 40% of the software we produce will contain some components prepared or produced by AI. At Allegro International, we achieved excellent GMV growth in the second quarter, 61%. We also increased the number of Smart! users to over 1 million, and the GMV generated in the application grew by over 100% year-over-year. Allegro International sales are mainly based on Polish sellers, but we're also consistently increasing the number of local partners. We have launched a new program aimed at significantly increasing the number of local sellers and supporting them in their sales. We're also completing the transformation of some of our international assets. In the case of Mall North, the process has been already completed. In our international development, we focus on the 3P model and group synergies. The growth dynamics show that we are doing this better and better. Jonathan Eastick: Thank you very much, Marcin, and good morning, everybody. It's great to be with you today, and I'm really looking forward to taking you through these really great Q2 results for the Allegro Group. As usual, I'll start with the Polish operations. Key KPIs are in front of you at the moment. Let me move to the next slide and the key KPIs behind the GMV. So as you've heard, the business accelerated in Poland in the second quarter. The main driver for that was increase in spend per active buyer. You can see there on the right-hand side that it's moved up sequentially to 2% growth on quarter-on-quarter, which gets us to PLN 4,178 of annual spend per customer, well over $1,000, and that's an 8% growth rate on a year-on-year basis. In terms of active buyers, over the last 12 months, we've added over 300,000. We're at 15.2 million active buyers for the Polish market. It's very important to remember behind many of these accounts are households. So there are millions of more buyers on Allegro than you see here. When it comes to GMV, up 0.9% sequentially to 9.8% on a year-on-year basis, PLN 16.5 billion of GMV generated in the second quarter. On a last 12-month basis, that moves our GMV up to PLN 63.4 billion, which is 10.1% higher than this time a year ago. It's also important to note that in the second quarter, we had a headwind from the fact that Easter had moved back into April from March a year ago. And for our categories, Easter is actually a headwind unlike for the grocery businesses that you also follow. So with that in mind, the result is even better than it looks at first sight. As usual, supermarket and health and beauty, high-frequency categories that we're focused on continue to grow faster than the average. This quarter, it was 2x faster. Looking for a physical measure of our development, as you know, we track items sold as a marketplace. That's up 11.4% on an annualized basis. It's also worth looking at the ASP on those items sold. Mix adjusted, the ASP is up by 1.7% year-on-year. This is the highest reading since the figures turned positive about a year ago and continues to move on an upward trend. And a quick word on Allegro Pay, 15.3% of GMV was funded by the Allegro Pay payment methods in the second quarter. Loans origination has moved up to PLN 3.3 billion in the quarter. So then let's look at revenue, and we've had an excellent quarter. The growth has accelerated to 18.1% year-on-year, landing on almost PLN 2.8 billion of revenue. And this is obviously coming from the GMV growth, combined with the higher take rates, strong performances from advertising, logistics and consumer lending. Focusing on the take rate, you'll remember from the previous call regarding Q1 that we increased the cofinancing rates in our annual monetization change in March. So there was 1 quarter of improvement included in the Q -- sorry, 1 month of improvement included in the Q1 results. Obviously, we now have 3 months' worth in Q2, and that results in the take rate moving up sequentially to 13.01% for Q2. On an annual basis, it's almost 0.5% higher than a year ago. You see as well on the bridge there, the rates of growth across advertising continuing to be over 30% quarter after quarter. Logistics moving up significantly, more and more of the services or the deliveries that they're doing are actually also the paid deliveries that we do outside of Smart!. So the logistics revenues are going up and also financial income being a driver behind the other income that you see on the slide. So with growth like that in revenue, it's relatively straightforward to grow EBITDA, and our EBITDA moved up by 14.2% for the Polish business in Q2. PLN 1.037 billion of adjusted EBITDA for Poland for the quarter. And you can see the impact of those revenue drivers on the bridge on the left-hand side there, the first 3 items on the bridge. Let's focus in a little bit on cost of delivery. PLN 156 million higher cost of delivery than a year earlier, which translates to a 23.1% increase in delivery cost. As a percentage of GMV, it's actually come down very slightly from Q1 from 5.1% to 5% of GMV. And most importantly, most of the growth in this cost has actually come from volume, from additional parcels from the higher GMV and from additional penetration of Smart!. You see that laid out there, 18.1% of the 23%, plus another 3.5% where Allegro Delivery is delivering parcels that are being paid for by the consumers. That leaves only 1.5 percentage points of impact that's coming from higher unit cost. And when you remember that on the 1st of January, we absorbed a double-digit indexation increase from our largest delivery partner, we're really very happy to see that we managed to offset most of that increase in the Q2 numbers. That unit cost increase is mainly held down in that way because of the growth in our Allegro managed volumes, which were up by 4.6 percentage points Q-on-Q to 34%. And in essence, every single delivery that we move into an Allegro managed delivery method is at a lower cost than the alternatives, and this is why we're now starting to see a significant positive impact on our cost of delivery. Looking at the net cost of delivery, which requires also considering the revenues that are coming from cofinancing, which are part of take rates, the net burden of running the Smart! program expressed as a percentage of GMV has actually come down in Q2 compared to Q2 a year ago. Final comment really on this slide is to draw your attention to the 6.27 percentage adjusted EBITDA to GMV, which is 24 percentage points higher -- sorry, decimal points higher. This is going to be the high point for the quarter -- sorry, for the year. As we expect going forward, as the year progresses that certain cost increases will need to be absorbed; higher salaries, higher costs of various delivery methods, other indexations. And therefore, the margin will come down a little bit later in the year. Moving on to capital investment. And we were signaling to you earlier in the year that the CapEx program this year is significantly more ambitious, and that's what you see in the numbers. 72% growth on a year-on-year basis for Q2 to PLN 193 million, which is mainly coming from an increase in other CapEx, which was up by 4x at PLN 80.3 million for the quarter. This is mostly obviously coming from investments in our logistics expansion. It's predominantly APMs, but also investments in our courier depots and network. When it comes to capitalized development costs, those are up much more moderately, up 22% year-on-year or PLN 20 million. The tech team is slightly larger than a year ago. Obviously, salaries are higher than a year ago. And they're actually spending more time programming new functionalities that Marcin was describing earlier than on maintenance, which is also increasing the share of the cost, which is being capitalized. When we compare to our medium-term guardrails where we've set out a maximum of 25% of Polish adjusted EBITDA to be reinvested into CapEx, our H1 situation is that we're running at a 20% spend. So comfortably within the guardrails. So let's move on from Poland and take a look at the international operations, key KPIs set out on the slide that you see in front of you. I will come back to why this is on a pro forma basis in a couple of minutes. But let's focus in on the Allegro International segment for Q2. Now as Marcin said already, it's been a very good quarter for the international marketplaces, which are our new marketplaces in Czech Republic, Slovakia and Hungary. Great growth across the board. Starting with the traffic, it's up 47% year-on-year. And this despite the fact that we've actually dialed back on our marketing investments and really focused on improving the ROIs on those investments on a going-forward basis. Active buyers up even more, 57.4% at 3.9 million active buyers across the 3 markets, which is a really strong performance. Spend per buyer also moving up 10.2% higher than a year ago at PLN 540. Looking then at the other key metrics, that means that the GMV growth was able to reach 61%, so very comfortably up at the top end of our outlook, and that's PLN 572 million of GMV from these marketplaces. Revenue was up even stronger at PLN 63 million, 111% higher than a year ago. The take rates are up by 2.6 percentage points on last year. More of the Smart! subscriptions are being paid for by the consumers. There's more revenue coming in from logistics. So altogether, revenue is moving up nicely. And that means that we were actually able to cut the size of the loss for the first time on a year-on-year basis. It's down PLN 21 million on a year ago, PLN 66.5 million invested in the marketplaces and the margin to GMV has improved to minus 11.6% in the quarter. Let's move on and take a look at the Mall segment. And as you've heard from Marcin, we've essentially finished the projects around transforming Mall in the northern markets of Czech, Slovakia and Hungary. And the main component of that has obviously been this intentional rundown of their legacy unprofitable e-shop business, which you see reflected here in the GMV for the second quarter, 58.7% lower than it was a year ago at PLN 184 million. That was only generating PLN 24 million of margin, as you see on the right-hand side. And with other cost savings, we were able to actually cut the loss to PLN 55.7 million. And most importantly, because we shut down now the independent operation, the independent front ends, we've been able to take further reductions in staffing. We've also been able to move out of the legacy warehouse, which is too big for purpose and move to outsourced logistics solutions. And those things will help us cut the loss much further in the second half of the year. So summing the 2 segments together, you get the results of international operations, which are shown on the next slide in summary form. And let me now come back to the topic of why those numbers were pro forma. We've made a change in the segment reporting between Q1 and Q2. And what's triggered this is one of the points I mentioned, which is that we've finally shut down all of the Mall North front end, the independent legacy front ends. And now, Mall North only trades as a lean merchant selling over the marketplace. Now applying the accounting regulations, what that means is that the Mall North segment no longer has an independent route to market to generate revenues. And in those circumstances, the segment needs to be rolled up into the bigger segment, the one that does have that capability to generate revenue. So as a result, we now will be reporting the Mall North operation together with the new marketplaces going forward. To see this in numbers, take a look at the next slide. And the key thing here is that the numbers themselves in total are not changing. So the total international operations, which you see there on the right-hand side of the slide is no different between the old way of doing the segmentation, the pro forma, and the new segmentation, which you'll find as reported in the financial statements, exactly the same numbers. The difference is that the Mall North segment moves out of Mall and into the Allegro International segment. You can see that in the gray boxes between the 2 tables and nothing else really changes. What's left in Mall is just the Mall South business, which is in Slovenia and Croatia, where they continue to operate using their independent e-shop. And the last part of this story is that the accounting rules also require when you make a change in segments to retrospectively restate all the history. And we've shown you what that impact is for GMV on the following slide. On the left-hand side, you have the way we've been reporting the marketplaces and their growth historically. And on the right-hand side, this new segmentation. Now what you see there is that the Q2 numbers are essentially exactly the same. And going forward, you'll be looking at the growth of the marketplace as we continue to develop it. When you're looking at year-on-year growth rates, you're going to see the impact of that shrinking legacy Mall growth in the prior year comparatives. And that's going to make the headline GMV growth rates look lower for a few quarters. So that's it for International. Let's move on and take a look at the consolidated group. I normally just talk about leverage when we look at the group numbers, and I'm going to continue that today. Let's start with the leverage as of 30th of June. It's moved down by 12 basis points of a turn to 0.72x adjusted EBITDA. It would have gone down even more if we've not made the decision to use some of the high cash balances at our disposal to increase the investment that we have in our consumer loan book. We put PLN 364 million to work funding Allegro Pay loans during the first half of the year, bringing the total to PLN 867 million. And that, of course, means we retain a bigger share of the financial income that's coming from these loans, sharing less of it with our financing partners and helping our EBITDA. We've also prepared for you a pro forma calculation for the 30th of June to show you what is the impact of the financing transactions that took place in the few weeks after the end of June. In particular, you see here the impact of the return of PLN 1.4 billion to shareholders via a share buyback for 3.7% of stock. Taking that PLN 1.4 billion out of the balance sheet, in effect, has moved the leverage up to 1.16 on a pro forma basis as of the 30th of June. And it will be coming down from there. We expect to be generating significant cash flow in the second half of the year, and we would expect to land around about that 1x leverage that we have in our medium-term guidelines and capital allocation policy as our target level for the group's leverage. So let me move on to the outlook, which, as you've heard from Marcin, is moving up for the full year. But let me just start with a quick look at how we've done at the halfway mark in comparison to the guidance as originally published back in March, which you see on this slide. The key message here is across all KPIs and all segments, we're on track. And the year is going very, very well indeed. Let's look at then current trading, which is laid out on the next slide. How has it been going in the third quarter? Well, we're continuing a gradual acceleration of the Polish business. The GMV is up towards 10% year-on-year. On the international markets, the international marketplaces that were growing 61% in Q2, we're still seeing growth in the 50% to 55% range, reminding you as well, we're now lapping Slovakia as well as Czech Republic results in these numbers. The Mall North legacy front-end GMV that I was describing in the context of the segment changes means that the results for this segment as a whole are going to be slightly negative because we still have these figures in the prior year numbers. And the Mall South segment, which has continued to be reported separately, is shrinking, but that shrinkage has slowed to mid-single digits. So looking at GMV on a group level, we're actually growing somewhat quicker than we were doing in the first half of the year. So that means moving on to look at the outlook update. As we get closer to the end of the year, we're either able to narrow the ranges because there's obviously less variability remaining or in some cases, we've managed to move up the guidance because we're getting increasingly confident we're going to move towards the top end of the range. And that's particularly true for the revenue and the adjusted EBITDA where our expectations are moving up. A couple of numbers just to call out. The Polish operations, we're expecting to come in on or around that 10% growth rate for the full year, but going faster in international than we were originally expecting. Revenues were up across the board. We're looking at 8% to 11% growth for the group and 16% to 18% for Poland. EBITDA costs very much under control, especially in Poland. So the guidance has moved up for Poland to the 10% to 12% growth for the full year. And capital investment, very much on track, no change in the guidance, but we are managing to do 1,000 extra APMs within the cost budget. So with that, I think you can agree that things are going well, and I'm going to hand it back over to Marcin to hit the key talking. Marcin? Marcin Kusmierz: Thank you, Jon. So let me remind you of our key achievements in the second quarter of 2025. A very solid improvement in almost all financial and operating results. We are very pleased with the growth in GMV, revenue, adjusted EBITDA and the increase in the number of users of our marketplaces and their growing spending. . Advertising and financial services are developing very, very well and have good prospects ahead of them. We are successfully developing our international business, focusing on 3P model, we're seeing solid and promising growth in GMV. We also have completed the transformation of Mall North in Czech Republic, Slovakia and Hungary. And we're continuing the strategic development of our logistics network and the Allegro Delivery program. Managed volume is already at 34% with an increase of nearly 5 percentage points quarter-to-quarter. The new agreement with DPD will certainly have a positive impact on the efficiency of the logistics area. And for sure, it will be accelerating the diversification process. We also have completed a very successful buyback and achieved a historically high free float of 72%. And last but not least, we're working with the Board about new potential growth opportunities to build additional growth drivers into annual strategy update. Tomasz Pozniak: Thank you, Marcin. Thank you, Jon. We have just concluded the presentation, and we're ready for the Q&A session. Jota, over to you. Operator: [Operator Instructions] The first question comes from the line of Holbrook Luke with Morgan Stanley. Luke Holbrook: My first one is just on your delivery partner network that's now handling about 34% of your volume. As you mentioned, it's up 5% Q-on-Q. It was up a similar percentage to the quarter before. So with DPD coming online, almost doubling, I guess, the amount of APMs you have through that network, how can we expect that to trend over the next 2 or 3 quarters, if you could just map that out for us? And then secondly, just on your comments that your delivery partners are now cheaper than your largest non-network delivery partner. I'm just kind of wondering how that looks in terms of when we can expect you to kind of announce the outcome of your renegotiations with InPost for your contract that's due to expire in 2027. Jonathan Eastick: Okay. Thank you for those questions. Yes. Let me start with the one about DPD. So obviously, we just signed the contract. There has been quite a lot of work going on in the background to get ready for DPD, but there won't really be much impact from DPD in Q3, obviously, because these deliveries will only kick in, in the next few weeks. It will have much more of a significant impact on the fourth quarter. And you rightly highlighted the fact that there's a lot more APMs, 11,000 additional points where we'll be able to funnel traffic, although they're smaller APMs than the others, means that it will also be a driver for increasing the Allegro managed volume metric, especially in the fourth quarter. When it comes to the pricing, obviously, we are talking with InPost and it's too early to make any predictions about if and when we will come to conclusions. We are very constructive about the situation, but we do need to see lower prices. And Marcin, if there's anything you want to add to that? Marcin Kusmierz: Yes. Thank you, Jon. I think you know that we are purely focused on the development of Allegro Delivery. And you see that we're inviting new partners to the program, all major players on the Polish market. So we just announced cooperation with DPD, the second player on the market. So thanks to that, we have the largest network of lockers on the Polish market and [indiscernible] as well. So this is the crucial point for us, and we want to invest mainly in development of this program. Operator: The next question comes from the line of Ross Andrew with Barclays. Andrew Ross: A couple for me, please. The first one is just to double-click a bit on some of the investments, but it sounds like you're discussing with the Board to help growth accelerate. I'm wondering if you can put a bit of a framework around that in terms of when we might see these investments and kind of how you think about margin investment in that context and then kind of when we might see Polish growth accelerate. And I appreciate it's hard to be specific, but if you could just give us a bit of a kind of directional framework, that would be helpful. And then the second question is to kind of follow up on that. In the opening remarks, you spoke about the idea of taking -- or kind of selling some of your services off-platform. On the fintech side, I think you touched on buy now, pay later, but are there any other fintech services that you could envisage being sold kind of off-platform? And you've also touched on logistics. Can you just be more specific by what you meant when you spoke about kind of selling your logistics solution? Does that mean taking other kind of merchant volumes through the Allegro One network? Does it mean something else, it would be helpful to better understand by what you mean on that. Marcin Kusmierz: Thank you for these questions. Of course, I just joined the company started in May this year. And of course, I was -- and I am still specialized in new business. If you look at my career and my development, I was always looking for some new opportunities, how to speed up growth, how to accelerate development of the company. And I do the same here at Allegro. So we started as a management team discussion with the Board, how we can accelerate our growth, how we see potential directions, also entering some new fields. But this is quite early stage. Of course, we see some new attractive parts of the market we can potentially cover. We see new product categories. We see services, as mentioned before, we see some cooperations or even strategic partnerships, thanks to that we can add something new, something extra to the platform and thanks to that attract new group of customers to us. You know that we have great potential and we have great position on the market, but the market is changing rapidly. So we try to discover all the time some new possibilities, again, to help our customers to find all they need at Allegro, but also, of course, thanks to that to accelerate our growth. And we're also discussing how we can use existing products we develop at Allegro, using example of Allegro Pay or using example of our logistics infrastructure. They represent absolutely the world class. They absolutely are the best-in-class in those segments. So we analyze how we can help our merchants, how we can use our infrastructure to be even more efficient. What is the attractiveness in creation of some new capabilities for our merchants? Because finally, as we saying many times, we want to build a very merchant-friendly ecosystem and to support their growth, of course, mainly on Allegro because we see and we know that this is the perfect place for them to do business together. But of course, we want to be as efficient as we could be. So again, we have many innovations. We have some advantage in comparison to other players, and we want to use these tools to be even stronger. Andrew Ross: So just to be clear on that, could that involve putting in kind of non-Allegro inventory through the Allegro One network? Jonathan Eastick: Andrew, it's Jon. If we were to go in that direction, it would almost certainly be on the Allegro Delivery level, right? So it might be non-Allegro parcels, but across all the partners in Allegro Delivery. But it's still at an early stage. As Marcin was saying, these are the areas that we can see a first look to expand our footprint of activity, which is another way to obviously find additional growth drivers. We're discussing these with the Board in this year's planning round. And we would anticipate starting to make tangible moves on some of these once it's all been agreed over the next few months in our planning process. Operator: The next question comes from the line of Reshetnev Roman with Goldman Sachs. Roman Reshetnev: Congratulations on the solid set of results. Just to follow up on logistics. InPost previously mentioned that 30% of their Allegro checkouts in Q2 included a prompt to use your delivery network. And given InPost's legal action and some customer pushback reported in the media, could you comment on how do you view the situation from your side? And as we enter the high season when service quality becomes more sensitive, how sustainable is this approach for volume redirection for you going forward? And second one on logistics, just like following the recent partnership agreement with DPD, what would be your long-term vision for logistics in Poland? And given you still have a long way to build out your own network and considering your stronger leverage position, would you look at some M&A opportunities in the logistics space? Jonathan Eastick: Okay. Thank you for the questions. I think the first part was relating to the arbitration case, if I understood correctly, that InPost has brought under the scope of the long-term contract that we have that runs until 2027. As we actually showed in one of those slides that Marcin put up earlier, have the capability to prompt customers in the checkout process to see and to consider using lockers, which are now available under the Allegro Delivery framework, either because they've just been deployed or because we've added partners, and we do that. We make use of that. I'm not going to comment on what percentage of the time, but we don't use it all the time. We respect the choices of consumers. But what's most important there is that in accordance with the agreement, the customers have just one click on a button that says change, and they can see the full list of all the available delivery methods that they have at their disposal and they're able to pick whatever they want. So we will see what happens in the arbitration, but we don't think that there's any merit to the claim. Now the second part was M&A and logistics. I mean, we don't really comment on M&A. I don't think there's any need to be considering M&A. The Allegro Delivery approach is working extremely well. The partnerships are working extremely well. Who knows in the very long term what may happen in an industry. But in the short term, there's no comment to make on M&A. Roman Reshetnev: And just a follow-up on the current trends, given that you already highlighted an update on the third quarter GMV growth. And since we're now in the high season, could you also elaborate on the EBITDA growth trajectory? And specifically, how would you describe the activity of Chinese marketplaces in Poland and international over the last months? And do you still see them driving significant pressure on customer acquisition costs? Jonathan Eastick: Yes. Thank you for that question. Yes, let me come back to the margin. Obviously, the margin was up to 6.27% in Q2, but we try to limit our monetization moves to once a year, and we've been doing that for a couple of years now in the first quarter. So it tends to generate a high watermark in the margin in the second quarter, and it will then trend down somewhat over the rest of the year because the salary raises, for example, are in April. Generally speaking, delivery partners need some kind of indexation increase during the course of the year. The IT providers are obviously also looking for increases. So as these things come into the numbers, plus a natural trend for the take rate to drop lower in the fourth quarter mean that the average margin for the year will be lower than that 6.27%. And obviously, you can back calculate it into the guidance that we've given you today that it's expected to land just under the 6% mark for the full year. Yes. And the second part of the question was around the Chinese. We are seeing an increase in activity. This kind of the rebound or the knock-on effect, if you want to call it that, from the tariffs and the changes that were imposed in the U.S. So there is clearly more activity of the Chinese players across Europe, not only in Poland, in recent months. But we're still not seeing a significant increase in the rate of increase in our own surveys. They're still in the similar sort of range. So there's a lot of top of funnel activity. We don't see that much of it coming through in the surveys that we do that try and look at where people are actually shopping in the month-to-month surveys. It is having an impact on our marketing spending. I didn't touch on it in the EBITDA slide, but you can see that we're up about, I think, 17% on a year-on-year basis. We're fighting on all fronts for the share of voice on all different advertising media. We're not going to cede any ground. We are the leader in this market. But yes, they're an important player. Marcin Kusmierz: And as Jon said, we see kind of limited direct competition because Chinese players, of course, they are strong, they are innovative, but they cover different parts of the market, mainly being focused on most price-sensitive customers. And this is, by the way, they show some potential for us or some parts of the market to be covered. But we should remember that the strength of Allegro is based on cooperation with 100,000 merchants from Poland and the region, and we have the widest selection of branded products. So again, we see, of course, some rising competition. But right now, we see that we cover a bit different parts of the market. Operator: The next question comes from the line of Potyra Michal with UBS. Michal Potyra: I just have follow-up questions. The first one on your net cost of delivery. It seems to have plateaued at 5% of GMV. So my question is, is this the level you are satisfied with? Or we should expect that to return to growth in the coming quarters? And the second question, another follow-up this time on the Chinese competitors. I just wonder, I mean, it seems that margin was lobbying in Brussels. There was also an article in FT on the topic. So maybe you can share some intel what are your expectations on the potential regulatory changes in either Europe or Poland, which could even the playing field between the international marketplaces and the incumbents. Jonathan Eastick: Okay. Let me take that first question. Yes, the cost of delivery that's at 5% of GMV is effectively the gross cost, we call it cost of delivery these days. And the short answer is we'd like to see that going down over time, right? And the way to do that is to successively blend lower than the average unit cost methods into the mix. And we're on a good path to do that using the Allegro Delivery solution. And hopefully, at some point as well, we may make a modified deal with InPost, but also obviously have a big contribution to that cost. The total burden though, of running the Smart! program and paying for deliveries is, as I mentioned, you need to take into account the cofinancing, which is up in the take rate. The net of the 2, we talked about in a bit more detail in Q1 in the previous update. When you net one against the other, the 5% comes down to about 2.5% of GMV, which is the net cost of running the Smart! program. And the comment I was making earlier was that it's ticked down fractionally on a year ago as a result of the cofinancing changes and this progress that we've made on controlling the gross cost. Hopefully, that's clear. And the second question was about the Chinese. Marcin Kusmierz: So we don't expect any kind of protection for Allegro or other European players. The only thing we expect is fair competition and to have the same rules for every single player existing or selling some goods on the European markets. So we know -- you know as well that this is today unfair competition. We see that, for example, the U.S. is acting faster and protecting the market against unfair competition. And our expectation is almost the same. So again, we appreciate that some companies that invest in development of European markets, and this is great. But we want to build our competitive advantage, thanks to having the same rules for everyone. Michal Potyra: But do you have any more kind of specific expectations about potential changes, the timing, et cetera? Marcin Kusmierz: This is quite complicated or complex topic. And of course, we work with other European players to create some pressure or to explain why some Chinese players, they use the European market on different conditions than we. So of course, we explain to authorities how the market should be defined and how we should act with some initiatives. And we are quite patient. But of course, we see that some Chinese players, they have some advantage, not because they are much clever or they are stronger or much more innovative, but because, for example, using some unfair advantage. Operator: [Operator Instructions] Ladies and gentlemen, there are no further audio questions at this time. I will now give the floor to Mr. Pozniak for any questions from our webcast participants. Tomasz Pozniak: Thank you, Jota. We have quite a long list of questions. Luckily, part of them already answered when they covered the questions asked by the analysts so far. Some of them, I believe, were explained during the presentation, the ones that came early. I will address them by topic rather than question by question because they touch upon the similar points. So the first question would be, where are we with the cofinancing and how much headroom we still have to improve it? Jonathan Eastick: Yes. Thank you for that question. So the cofinancing move that we made in March moved the share that's being carried by the merchants up to approximately 45% of the total cost. That will tick down, as I said, as we absorb indexation increases from some of the players that have different timing to InPost in their contracts. But essentially, we don't have plans to move it up very quickly from here. The long-term expectation that we've mentioned many times is that we see a 50-50 split as being something which merchants can comprehend and still be excited about, and it's very typically the level that you see around the world. So we probably will get there eventually. But we would think that we've gone from 0 cofi to this level in about 4 years. So we won't be moving up so quickly going forward. Tomasz Pozniak: I believe the next question would be to Marcin because this is asking about the AI-driven marketplaces, AI chats taking away our business. Can you comment on this? Marcin Kusmierz: Yes, absolutely. We do cooperate with all major players producing AI technology or potentially giving us some access to AI capabilities. And we rather perceive it as a chance for us to have additional sales channels. So this is not kind of competition. This is something supportive for us. And we, again, do cooperate with all major players providing this technology. We know how to use to improve efficiency. We know how to use this technology to achieve better conversion on our marketplace and how to create some new extra value, thanks to purchasing through applications. So we perceive it as something positive to us and hoping that new models will be implemented commercially quite soon because as I said during the presentation, we are pretty matured with this technology, and we know how to build advantage of using AI. Tomasz Pozniak: The next question will also be to you, I believe, because this covers the recent changes to the regulations concerning access to the Allegro API. And this has triggered some comments on the web. So what is the main reason for doing this? And can this have impact on our KPIs? Marcin Kusmierz: This is an interesting topic, but this is a technical change because API, this is the protocol used by our partners to manage their products on the marketplace or to automate some processes. And some of our partners, they shared the access to API to other companies without permission for example, and we do invest heavily in development of API because this is something that supports in boosting sales on marketplace and also helping our merchants to be much more efficient. So this is something that we want to secure efficiency of this protocol and to help merchants. Tomasz Pozniak: The next question, international operations. Are they still a strategic priority for the group? Or could potential exits from loss-making operations be considered? Marcin Kusmierz: This is a strategic point or strategic direction for us. And of course, we are still mainly focused on the development of the Polish market, and we are here over 25 years. But we are present in the region, not by accident. This is something like a strategic move for us, and we see that we are able to create some special unique value for customers living in Czechia, Hungary or Slovakia. We see increasing number of customers using our marketplaces. We see increasing number of Smart! users. We see also huge demand from merchants using our marketplaces to cover some expectations of people living in the region. So there is no consideration today that we will be only Polish company. We want to stay in the region. We want to develop these markets. And this is quite early stage of development. Let's remember about that. And we're consequently improving our position and our competitive advantage in comparison to any other player on the market. So yes, we want to invest and we want to be there. Tomasz Pozniak: Thank you. And I believe we have time for just last question. So could we comment on the OCCP case related to our trees being planted for the packages delivered in Allegro boxes -- status and potential impact on the financials? Jonathan Eastick: Yes, there isn't too much to add. There is a conversation going on with OCCP about their findings. We don't know how that will play out. We planted an awful lot of trees, which we're actually very proud about, and we want to continue that. And as part of our branding identity of Allegro One, but it's also inherently intrinsically a very good thing to do. So if something happens, then we will reflect it in the financial results. We certainly don't expect anything material from it. Tomasz Pozniak: Thank you, Jon. So that was last question answered by the management. I will address offline a few technical questions that are still there. And thank you very much, everyone, for participating. Jota, over to you for the conclusion. Operator: Ladies and gentlemen, the conference has now concluded, and you may disconnect your telephone. Thank you for calling, and have a good day.
Operator: Welcome, everyone, to the half year -- Welcome, and thank you for joining Exor's Half Year 2025 Results Conference Call. Please note that the presentation materials and the related press release are available for download on Exor's website, www.exor.com under the Investor and Media Financial Results section and any forward-looking statements made during this call are covered by the safe harbor statement included in the presentation material. [Operator Instructions] Please note that this conference is being recorded. At this time, I would like to turn the conference to Exor's Chief Financial Officer, Guido de Boer. Sir, you may now begin. Guido de Boer: Fantastic. Thank you for this introduction, and happy to have this half year results call. And as you'll see in the new format of our half year report. I hope that gave good insights, and I want to take you through the highlights in this presentation. So our NAV per share outperformed the MSCI World Index by about 5%, largely aided by the EUR 1 billion buyback. Companies did well, but a mixed bag of performance across the different companies, which we'll address a bit later. We're particularly pleased with the performance of Lingotto performing with an 11% increase, mainly from the public investment part in the backdrop of the declining market. And this half year saw us monetizing EUR 3 billion of Ferrari stake as well as some other items leaving us with good firepower to monetize, to invest in the future. And it leaves us with a very healthy debt ratio at 5.5% of our GAV. So moving to the key figures at the half year. Our gross asset value went down by EUR 2.5 billion, partly from value changes, partly from the buyback and our NAV moved in line with that, while our NAV per share saw an increase and our loan-to-value, as mentioned, is more or less half than what it was at the end of 2024. So our NAV per share growth went up by 0.9%, and 3.2% of that growth is attributed to our buyback, given that we buy back our own shares at a discount the positive impact on NAV compared to the number of shares that we reduce is delivering this growth. So even ex buyback, our portfolio has done better than the MSCI World index. And this is an important measure because we want to outperform relative to the index. We also want to show absolute returns. And in that sense, obviously, we're disappointed that our TSR, even though better than the market is negative, and we aim to improve that in the coming period. So if we move to the overview, I first would like to present to you a new classification. And rest assured, I don't want to make a habit of this so that you need to change your models all the time. This was actually intended to provide you further insight and probably also ease for building your models. Given that Exor Ventures is now managed by an external investor. We moved that to the other funds moved by third parties into others. And you really see separately the performance of Lingotto, which are the funds operating under our own management. And we thought it's useful not to group cash and cash equivalents under others but show separately also, if you want to look at a net debt basis to facilitate your analysis. So hope it's helpful. And if you have any comments or suggestions or requests for historical data, please feel free to reach out to the Investor Relations team. So if we then move to the drivers of change in gross asset value in this new format and maybe starting on the right-hand side, you see the change that I mentioned previously of a GAV of EUR 42.5 billion to EUR 40 billion, which split in EUR 1.1 billion of shareholder distributions, around EUR 100 million of dividends and EUR 1 billion of buybacks. So it's a decrease of GAV, but not necessarily reflective of performance, adjusted capital distribution. And you see EUR 1.4 billion decrease in value, which is the real metric of our performance on GAV. If we then move one column to the left, cash and cash equivalents. Here, you can see well the movement in our cash flow, where we've invested EUR 1 billion in new investments. We realized EUR 3.5 billion of disposals and obviously, the EUR 1.1 billion in distributions. So if we take the EUR 1 billion in investments, you'll see and we'll go into more detail later. EUR 4378 million went into listed companies, principally Philips and a minor part in Juventus and then a bit in commitments on Lingotto and EUR 428 million in others, which we invested in bioMérieux. The disposals line for EUR 3.5 billion breaks up quite simply in EUR 3 billion for Ferrari and almost EUR 0.5 million of proceeds from the reinsurance fee costs that we invested in as part of the sale of PartnerRe. Now we have the line change in value, which I propose we address in a bit more detail in the following slides. So performance of listed companies. I mentioned already the investments behind Philips, Juventus and the disposal of Ferrari. If you then look in the change in value, you basically see that the change in value of Ferrari is marginal, where it started on the first of January and where it landed on the 30th of June. We were quite lucky in our timing that we did the trade at the all-time high in that period, but a very flat movement in between start and the end of the period. CNH, a similar story, and we measure our returns in euros and in euros, it was flat, notwithstanding a strong movement between the dollar and the euro. The big driver of the decrease in value was the disappointing share price movement of Stellantis as well as that of Philips, which started the year a bit above EUR 24 was at the half year at EUR 20 and now ranges around EUR 24 again. So the good thing is the EUR 700 million of loss has rebounded in the year-to-date, large. And then obviously, the positive news in the half year was also the strategic transaction on Iveco which in the run-up to that transaction led to a significant increase in the share price. And that is a monetization for Exor at a very attractive price, as well as a good home for Iveco for the future is that the pending transaction will complete in 2026. So those are the key moves in listed companies. If we then move to unlisted companies. We had some smaller investments between -- behind Via Transportation where there was some shares available ahead of the IPO. And I'm happy to say that following the successful IPO on NYSE last week, we'll move Via to the listed companies in the following reporting and some existing commitments we have on TagEnergy and ShangXia. And you'll see the movement in value, where the largest ones Institut Mérieux on the back of the increase in share price of bioMérieux, Via Transportation based on its strong performance. Welltec and The Economist actually largely FX movements and the other amounts are relatively smaller. So if we then move to Lingotto and others. You see we invested in private strategies around EUR 166 million. And you see a very strong performance of the public investments, notwithstanding the equity capital markets in general, declining. So we're very happy with how the Lingotto funds deliver returns, which are less correlated to the rest of the portfolio and outperforming the market. We then move to others. There, you see funds managed by third parties. So that also now includes Exor Ventures. And it was also including the reinsurance vehicles where you see the half billion of disposals. So we're quite positive. The funds are doing quite well. The minus EUR 72 million is actually EUR 427 million negative FX and both Exor Ventures as well as the reinsurance vehicles in local currency have been performing well. In listed securities, you see, again, the investment of EUR 317 million in bioMérieux and the change in value is largely due to the decline in share price of Neumora and smaller investment that we've done in the past. And I think those are the main items to highlight in Others. So Cash and Cash Equivalents, I largely mentioned this previously, we had strong dividend inflows of EUR 624 million, of which we distributed again EUR 1.1 billion to our shareholders. We raised disposals between EUR 0.5 billion, which we reinvested for EUR 1 billion, and we repaid bank debt for EUR 547 million and a bit of a bond, which leads us to a cash position now of EUR 1.5 billion, which is obviously very, very healthy. And that's in line with gross debt that, as I mentioned, with the reduction in bank debt and the bonds now stands at EUR 3.5 billion rather than the EUR 4.1 billion at year-end. And as you know of us, we try to have a very stable maturity profile. So we have no cliff payments and on the short-term obligations that we have here can easily be filled out of our cash positions. So with that brief summary, I would like to open the floor to Q&A. So over to you at the operator. Operator: [Operator Instructions]. We will now take the first question from the line of Monica Bosio from Intesa Sanpaolo. Monica Bosio: I have three. First of all, on the future investments. My perception is that maybe the group priorities are more on the health care side. Or do you see real true opportunities in the luxury segments? I'm just wondering because in the last conference, the company didn't see real opportunities in the luxury segment. And the second question is on the size of the potential acquisitions. The press speculated a lot on this. Any comment from you on this side? And do you have any time horizon for the completion of the new investments? And the very last is not only investments but mainly on disposal, should we expect in the coming future, some other disposal on top of [ Lifenet ]? Guido de Boer: Fantastic. Thank you, Monica. Good questions as usual. So in terms of priorities for us when evaluating a potential acquisition, we look at fundamentals. Does it have the right strategic fit our financial fundamentals, cultural alignment with us as an owner, what our leadership strength with us their governance proposals. And we base this on analysis of each individual company. So it can be health care. It can be luxury. These are in particular industries where we have domain knowledge within the team, but it could even be outside that, if the investment opportunity is sufficiently attractive for us. So there is no priority preference of health care over luxury. In terms of size, we basically have said that we are considering to do transactions, which are meaningful in the perspective of our total GAV and 5% is a percentage where this is -- becomes meaningful. But again, we look at every individual opportunity to decide if it's attractive or not. And on disposals, we continuously evaluate our portfolio to decide whether we should increase our stake like we've done on Philips in the period or whether it's a good time to dispose. If there's anything to update, obviously, you will be the first one to know. But for now, there's nothing further to mention. So Monica, I hope this answers your questions. Operator: We will now take the next question from the line of Martino De Ambroggi from Equita. Martino De Ambroggi: The first question is on the financial flexibility because once you divest Iveco stake, you will have another EUR 1.3 billion cash in. So would you prefer to look for one more big ticket, as you mentioned, 5% of GAV or buyback could be another priority. And specifically on the buyback, you don't need any divestiture to continue to buy back shares. You already finalized EUR 1 billion buyback in one shot, but why you are not starting additional buyback considering the high discount to net asset value. And the third question is on the -- well, sorry to be more specific on the name, but Armani is I don't know, up for sale, probably not shortly and so on. But just from a theoretical point of view, so just theoretically, could it be an interesting asset for you or you're absolutely out of the game, even if today, it's too early to talk about it? And very last on Ferrari, when you sold the stake, you mentioned there was an excessive concentration in terms of asset value. Today, Ferrari is roughly 90% of the net asset value. So the issue of too high concentration could come back. But what's your way of thinking about it for future in case the concentration further increases? Guido de Boer: Yes. Thank you, Martino, and good to have you on the call again. So on buybacks, they are part of our resource allocation process. And in a sense, the buyback, the discount is also an opportunity for Exor to reinvest capital. And for investors that want to remain on to benefit from a NAV per share increase from that, which you've seen in this half year. We've just done EUR 1 billion of capital return. So in terms of our market cap that is something that's very, very sizable. But -- as I mentioned, every time we do our portfolio review, we consider to increase or reduce the holdings in existing companies. We consider new investment opportunities that we have and we consider buybacks, and we decide on what we feel is the most attractive choice or multiple choices between those. So we'll continue to do that and consider buybacks as part of the process. Armani, don't really have anything to comment on the individual transaction as we obviously never do that. And Ferrari, the concentration has nicely reduced. It was 43% when we did the transaction, we're now at 39% of our gross asset value, which is the way we look at it. Indeed, if you look at it as our market cap, you probably meant 90% of market cap rather than net asset value. That is high, but then you could almost see Exor as buying Ferrari and getting the rest for free. So in that sense, I would see this as a great opportunity for investors to buy into the extra stock. And concentration, maybe to have that as a general point, we like concentration because our belief is that if we buy 1 share of every stock in the index, we perform like the index, and we want to outperform. So we invest in companies where we have conviction. And Ferrari is absolutely one where that holds true. So I hope this addresses the point you raised, Martino. Martino De Ambroggi: Yes. Thank you, Guido. And you are right. I mentioned as a percentage of NAV, but it was on market cap. One more follow-up on Lingotto which made a great job because the performance was very strong. Could you remind us what were the main drivers for this performance? And in terms of strategy, are you planning to open the doors or to accelerate on third parties asset? Or this is something that is not in your -- on your table? Guido de Boer: So one for us to invest more or less behind Lingotto strategies is part of the portfolio review process, as I mentioned. And if we would invest more behind existing strategies or if there's new ones, we'll obviously announce that to the market. For us, our strategy is not to grow assets under management and gain management fees. Lingotto was created to deliver performance to us. So I think that is critical. We want to grow our assets under management through performance rather than capital inflows. And as you see, we are delighted by the performance at it, showed in this half year, which it has been showing over a longer period now. So the quality of investors that we've been able to attract makes us obviously very pleased with having put the funds behind Lingotto. Martino De Ambroggi: And about the first half performance, is there any specific driver leading to such a good performance? Guido de Boer: I think they're great investors that know how to find the stock that perform well. Operator: We will now take the next question from the line of Joren Van Aken from Degroof Petercam. Joren Van Aken: A lot of great questions have already been asked. But just one from my side. I remember Mr. Elkann saying a while ago that private valuations were higher than listed assets and not long after that you bought the Philips stake. Today, I'm hearing that high-quality assets in the private market still have very high valuations. Do you think that the bid-ask spread has narrowed sufficiently on the private side? Or do you think that listed is still more attractive today? Guido de Boer: I'm not sure if I've seen too much reduction in price expectations from private assets. So I don't think that much has changed on private asset valuations and public market valuations, I think that's your day job. So you know much better than me, but also there, I would say there is a big disparity between certain type of companies like the large tech companies versus some slower-growing companies or companies that have 1 quarter earnings miss, which have then a disappointing share price performance. So I think if you look in public markets, there's definitely opportunities to be found but also private assets can have their individual situations that the valuations are attractive. So apologies for -- not trying to evade your answer with your question with a clear answer. But I think there's not a one size fits or response to your question. So Joren, I hope that's clear how we look at this. Operator: We will now take the next question from the line of Hans D'Haese from ING. Hans D'Haese: And I wanted to state first, Guido, that really happy with the new tables layout and increase even better transparency already was happy with IFRS 10 change and how this really helps also with the valuation drivers for listed companies and so, a very good job. Then regarding portfolio, we've seen that you've been very explicit in what sectors Exor would like to increase its exposure and for what, so thank you for that. In the meantime, we only saw a considerable increase of Philips. So we are waiting for other stuff. If now opportunities arise for acquiring minority stakes in other companies, companies, for instance, that you already are an important shareholder like, for instance, The Economist. Would you consider to increase the stake? Is this something that would fit in the portfolio? Or are you sticking to it should be health care literally? That's one question. And then the second one, in light of market expectations of further U.S. dollar weakness and considering that your stakes in CNH and Clarivate and Lingotto are dollar sensitive. What is your hedging strategy? Are you considering -- are you doing something? Or is this something that is not part of the strategy of Exor? And then third and last question, what are your considerations about investing in Bitcoin and cryptocurrencies? Do you see them as an alternative for your cash position? Or do you see them as a different asset class? Is this -- just do you want to share your thoughts about this? Guido de Boer: Yes. With pleasure. Thanks, Hans. First, for the compliments, much appreciated because we've been working hard on providing information to you and all our other stakeholders, which is as clear as possible so that we can talk more about fundamental activities like you now asked about. So much appreciated. On portfolio, whether we would consider investing in existing companies versus like, for example, The Economist or in only health care technology and luxury. We are, in a sense, agnostic. Why have we said health care, technology and luxury? Because these are sectors where we think there are structural tailwinds and where we've built up a domain knowledge. So we know all the good players in the industry. We know subsectors of those industries, which we like. And in that way, we feel we can uncover opportunities that maybe others don't see. So that's why our focus is there. But if we see another opportunity either in our portfolio already, which obviously has many advantages because we know that asset or outside, we're very open to consider those as well. So we're not married to investing in health care, luxury or technology. On the U.S. dollar, we don't do any hedging. Hedging, I think, is a useful measure for covering short-term exposures, which you cannot offset for a production company, hedging your fixed cost if you import into a country when your sales and you cannot change your prices. But for us, as a long-term investor, we don't see hedging as a valuable tool. There might be actually a short-term opportunity to say maybe with the devaluation of the U.S. on a relative basis, U.S. companies have become more attractive than 6 months ago. So we look at it more from that perspective. And then utilizing the dry firepower that we have now. We're quite conservative on that and put it in cash spread over euros and dollars across multiple banks, including many of you who are in this call. So stable banks across currencies at a decent return because this is not where we want to make our money. So that's why crypto or Bitcoin would not be places where we would park our money. Where we want to take risk is in the long-term investments that we do and not in the short-term liquidity storage that we hold. So that's how we look at it today and not voicing an opinion on Bitcoin or crypto because there's many people who are much better positioned than I to speak about this. Operator: We will now take the next question from the line of Alberto Villa from Intermonte SIM. Alberto Villa: A couple from my side. Many have been already asked. But again, on Lingotto, congratulations to the team, a very great performance. Now it's 8% of the GAV. Is there any internal limitation you put yourself in terms of size of the investment of your funds in Lingotto or it could grow further in the future? The second question is a more general question is about the -- let's say, when you consider investing in a company with the current geopolitical uncertainty and turmoil, if you're now looking more specifically to some regions rather than others, if there is any, let's say, change in the approach on a geographical standpoint compared to the past due to what has been happening in the recent past and presumably will continue to be a very volatile environment on that side. Guido de Boer: Thank you, Alberto. So on Lingotto, I think the limitation breaks down maybe in 2 parts. One on individual funds and two on allocation to Lingotto in a whole. So as I mentioned earlier on Lingotto as a whole, we always take Lingotto as part of our portfolio review strategy and we see do we want to allocate more to existing strategies or new funds, and we decide what kind of returns, risk, reward do we get against this, and we make an investment decision based on that. In terms of limitation, and I think it's a very important question, which goes to the core of Lingotto. For us, it's key that the investors behind the Lingotto funds focus on performance and outperformance. So the limitation is the size where adding further assets under management would go at the detriment of performance, and that would be the limitation. And that's obviously different for different types of strategies, whether it's public or listed and which markets they are. But that's where the key limitation probably is for individual Lingotto strategies. And then geopolitical, it is an important investment consideration, obviously. It is also a potential opportunity if those have led to significant price movement because we are a long-term investor. So we do take that into account, but I cannot say that, that has led to exclusion of certain regions or countries where we would say we're absolutely not looking there. Operator: [Operator Instructions]. We will now take the next question from the line of Andrea Balloni from Mediobanca. Andrea Balloni: Few questions from myself. My first one is a follow-up to the one of Martino and sorry for asking again, which is about Ferrari. I was wondering if you find some very good opportunities to invest in -- would you even consider another partial disposal of Ferrari to finance the investment? Or on the opposite, the current stake you have in Ferrari is a level you are not willing to lower? And my second question is about current holding discount that we see at 50% despite the material share buyback you have recently done, what could be, in your view, a way to shrink this holding discount as of today? And my very last question is on Philips. I remember when you have announced the acquisition of this stake, you mentioned that you were convinced to be able to extrapolate some value from a company that was clearly undervalued by the market. But just to understand what time horizon you had in mind for this asset? Guido de Boer: Thank you, Andrea. So on Ferrari, our view remains as what we said earlier in the year that our commitment to Ferrari is as strong as ever. And we didn't do this disposal about reducing our interest of the company. It was really a strategic decision to reduce our portfolio concentration as well as creating room for the next opportunity. So we're actually extremely happy that Ferrari is still a significant part of our portfolio. And as I said, we do like concentration and are confident that Ferrari will be a strong contributor to future results. So on the holding discount. What are we doing about it? I think calls like now based on clear and transparent communication are one important part of it. But even more important is we need to continue to show a sustained outperformance, both on an absolute and on a relative basis. And I think it's interesting also to have a look at the long-term performance of Exor versus the MSCI World Index because that's really why we want people to invest in our stock because we are long-term investors and by compounding better returns than the index over a long time, we will create significant value for our shareholders. So that's something we'll just continue to do. But if you have other views of actions that we could take, always happy to hear them from you and either reading it in your report or to have a call on that, if you like. So Philips, we continue to believe that the company has a huge potential and that it's delivering on its potential. So we're quite excited by its operational performance and our conviction also remains strong and happy with the progress that they're making. So our time horizon is long. We're there for the long term. We don't have any specific horizons where we say at this moment, we exit. So there's not a year that I can mention you of our planned horizon for an investment like this. Operator: This concludes the Q&A session. I would like to hand back over to Guido de Boer for closing remarks. Guido de Boer: I would love to thank all of you for your very thoughtful questions. I think this was all valuable and also gives us some good inputs to sharpen our strategy. So very happy you all joined this call, and please reach out via the usual channels, if you have any further information request or I would like to speak to us in any other way. So thank you, everyone, and have a nice day. Operator: Thank you. Ladies and gentlemen, this concludes today's conference call. Thank you for participating. You may now disconnect.
Operator: Good afternoon and thank you to those of you who are joining us. There is quite a number of you. So if you just bear with us, we'll allow everyone into the meeting. Great. Okay. Well, thank you for joining us this afternoon. We're here to hear from McBride plc, who announced their results earlier this week. Today, we're going to have a brief introduction followed by a video, and then on to the main bulk of the results presentation, which was shared with analysts, as I say, earlier this week. Then, we will have an opportunity for Q&A at the end. Please feel free to submit them as we go through the presentation, and we will take as many as we can in the time that we have allocated, which is the hour. So without further ado, I will hand over to Chris Smith. Christopher Ian Smith: Thanks, Hannah. Good afternoon to everyone. Thank you for joining this call. So as Hannah said, I'm Chris Smith. I'm the CEO, been with the group coming up for 11 years now. And I'm joined here today by Mark Strickland, who's our CFO, who's been with the group around 5 years. I thought -- so first of all, we're going to kick off with a very rapid introduction to McBride for those of you who don't know anything about us. We have a small corporate video, which explains a bit more. And then we will, as Hannah says, rattle through the results presentation we gave yesterday. So look, this is right on the page. We are the #1, the leading supplier in our space across Europe of household cleaning products. We're all coming up for 100 years old. We are a pan-European business. We are not just a U.K. business. Our heritage is U.K. We're coming up to 1927, it was formed in Manchester. But we now have something between 3,500, 3,600 people across 18 locations and 13 countries selling over 1 billion consumer units to our customers, which are predominantly retail customers. So you'll see here on the bottom left, 84% of our business is what we call private label or white label. So this is -- and I'll come on to a bit more about what that is. And we have a small amount of volume into contract manufacturing where we manufacture for brands. You'll see on the bottom right. We are a pan-European business. Everyone thinks we're just a U.K. company. We're not -- U.K. is our third biggest market. Germany is our #1 market, nearly 1/4 of the group. In France, U.K., Italy, Spain, the main countries. And we are doing, as you'll hear in the results, just under GBP 1 billion of sales in the year to June 2025. Next slide, please, Hannah. So look, it's really important for people to understand, I think, in our business model, private label or some people call it white label is at our core. That is the roots of the business and the absolute core mission of the company. You can see our purpose statement here, everyday value cleaning products. So every home could be clean and hygienic. We are your everyday supplier of everyday products that you see in the supermarket aisle, and I'll come on to the product ranges in a moment. I just would like to point you, if you get the chance and you're on LinkedIn, join us and look us on LinkedIn. We've just been doing a series of interesting articles that paint the backdrop to what is private label, -- why -- what is fast followership mean? What does McBride offer to the market. So there's some really good posts that have been coming out in the last 3 or 4 weeks. I would point you to look at those if you get the chance, gives you a nice background around the company as well. Next slide, please, Hannah. So the products that we manufacture are summarized here. And in reality, the sort of really the main 3 thrusts for the group are laundry products, dishwashing products and surface cleaners or household cleaners, we also have some air care products from our aerosols business. And in laundry, everything you would imagine if you're stood in the aisle in Tesco from laundry powder to laundry liquid to laundry capsules, to fabric conditioner, stain removals, all those sorts of things that you would see dish, the same, tablets for automatic dishwashing machines, dishwash powders and of course, also hand dishwash, very liquid equivalents. And cleaners is everything you imagine with a spray onto a surface, table cleaning, surface cleaning, antibacterial sprays, toilet cleaners, bleach, all those sorts of products. So absolutely pretty much everything you will see in the household aisle of a retail partner. Next slide, please. We run our business across 5 divisions, product-driven. So you can see the 5 divisions here, liquids, which is anything that you pour basically out of a bottle, out of a carton, out of a pouch. We do what we call unit dosing. So those your dishwash tablets, your laundry pods and increasingly, these soft pods that you have in dishwash. Powders is what it says on the tin, it's absolutely the familiar thing that most people remember in laundry powders and dishwash powders. Then we have an aerosols business. And we have a kind of incubator [indiscernible] business in Asia doing predominantly actually personal care and household products. Next slide. The industry, as you all know, and you will see if you stand in the aisle of supermarket -- is all about ultimately innovation in the products that you're being offered as a consumer. And the real focus in innovation nowadays is all around packaging and compaction, better formulation to reduce carbon footprint. McBride is at the forefront of this in the private label space, whether it's recycled plastic, we have been the first to market, for example, with laundry liquid in what looks like an orange juice carton. You can buy that in Sainsbury's, for example. We're the first to market with a paper bag rather than a plastic bag for laundry powders. And we're the first as well to the market with a cardboard box rather than a plastic tub, for example, for laundry capsules. So the world is moving fast. The retailers are very demanding in this space, and it's a key aspect of our business, as you might imagine. And then finally, on the sort of [indiscernible], why is McBride successful and the #1 in this space. And look, we pride ourselves on being the most competitive, the most reliable and the most innovative supplier to the trade across all the markets in which we operate. We are hugely customer and market-oriented and focused. We bring significant scale. That brings fantastic distribution networks. It brings buying scale for things like raw materials and also, of course, things like innovation. We are distributed in our asset base. Transportation is expensive to move bottles of washing up liquid around. So we have a distributed asset base, pretty unique in the industry. We pride ourselves on expertise and being absolute leaders in the specialisms that are needed for these categories. And with our new strategy that's been in place now for 3 to 4 years, absolutely focused and disciplined on what we're trying to achieve in our strategic outlook. So that's a very, very rapid rattle through but McBride at a glance. Hannah, we now got a corporate video, if you would go to play that. This is available on our website, the corporate video, by the way, in the who we are section. So if you want to watch it again, you can at your leisure. But over to that. [Presentation] Christopher Ian Smith: Great. Thank you, Hannah, for sharing that. So look, we'll now move on to the slide deck that we presented yesterday and as part of our results announcement. And look, it's really -- it was an absolute pleasure, and I'm super proud as part of the leadership team to be able to present the numbers that we did yesterday, continued proof really of our rebased much improved business. I'd like to think that another set of strong performance results as we're sharing with you today will begin to turn heads as we cement our performance at these new levels as the leading business in its sector in Europe. And as you'll hear through this presentation, the group is confident of its position and progress towards its strategic goals. This confidence is behind the reinstatement of our annual dividend, all of which will help support more investor interest in the group and the potential value opportunity. As you will hear shortly, McBride is also a much stronger all-round business. Our platform is much improved. Yes, we've turned around the financials. We've doubled our EBITDA returns from historic levels, and we've normalized our balance sheet in the past few years. But equally worthy of note is the extent to which we've improved many of what you might consider to be background features and aspects of the group's performance. And therefore, our credibility with customers, suppliers, colleagues, banking partners and other stakeholders is much improved. These core capabilities have committed McBride to continue to grow in a competitive and price-sensitive market while sustaining these high levels of profit margin. We've seen a lot of doubt in recent years that we can maintain these profit levels. So I'm delighted to say this is our fifth consecutive reporting period at these new profit levels with our outlook consistent to retain at this current level. Our heightened profitability has translated well into strong cash flows, strong cash generation. Our net debt has fallen again. It's now close to GBP 100 million, and our debt cover level is well ahead of our 1.5x target. We mentioned at our Capital Markets Day 18 months ago that we had a series of options and ideas to support further growth and expansion of the group as part of its strategic growth agenda to further its leadership in the industry. Our balance sheet is now able to permit the group to be considering these options behind what we call our Core+ and our buy-and-build ambitions. Finally, this financial position overall and our confidence for the future has permitted the Board to announce the reinstatement of annual dividends with this first dividend for over 5 years now recommended at 3p. Next slide, please. And again, thank you. At our Capital Markets Day in March 2024, we outlined our strategy direction and our midterm financial targets. It is really pleasing to be able to report good progress towards these targets as outlined on this page. In revenue terms, our growth ambition of 2% per year is a volume target. And whilst revenue growth in the last 12 months in GDP terms was up just under 1% in volume terms, our growth was at 4.3%, demonstrating continued progress with our growth task. Our profitability held at 9.3% in terms of EBITDA. Good profit growth in our powders, unit dose and aerosols businesses was offset with slightly weaker margins in our liquids business, which was off just under 1%. As I said, our cash performance was very pleasing despite increased capital expenditure, net debt fell again and debt cover is now at 1.2x, beating our target of 1.5x. Part of the net debt improvement was a result of good working capital management, which offset higher capital additions with the result that ROCE held at levels reported last year at 33% and significantly ahead of our 25% target. I will update you shortly on our transformation program, but this remains central to our strategy delivery and is now delivering net benefits and remains on track to hit the GBP 50 million cumulative net benefit over 5 years. The leadership and the Board of McBride are focused -- are laser-focused, should I say, on delivering the strategic ambitions for McBride and its stakeholders, and we remain confident we have the right team and the right direction to deliver on these targets over the midterm. Next slide. Whilst most of the headlines as the investor audience will want to hear will center around our improving financial metrics, I'm also super proud of the excellent performance across a range of our other crucial areas that point to McBride being a stronger overall business now and for the future. Service levels to customers, we call it CSL is a key hygiene factor for any supplier into retail. Our work in our transformation program on service excellence and strong focus across the business has seen the best service levels in the group for over 6 years. This positions McBride really well for any new business opportunities, margin management conversations, but also keeps our logistics and internal servicing costs to the optimum levels. Ensuring we're as efficient as possible in our manufacturing has stepped forward again this year with focused continuous improvement teams driving machine efficiency in the factories, yielding on average something like a 2% improvement in operating effectiveness. And finally, on this slide, I'm not going to go through all of these. I'm just going to talk about our sustainability ambition. We have continued to make real progress with our carbon footprint reduction ambitions, real reduction in absolute carbon levels in the last 12 months despite volume growth and actually reporting an -- what we call an intensity level reduction of minus 8%. So well on track to deliver our carbon commitments. Next page, please. A key feature of our reset business and our new strategy is to be far more informed and better aware of what is happening in the market as a whole. We have spent a significant amount of time developing our data analytics to support our understanding of how we're performing relative to the market and how the market itself is performing. We buy panel data for the 5 countries that the flags are shown on this slide, and we can track quarter-by-quarter a rolling 12-month total market position of both branded and private label products in the categories that we supply. The graph on the left shows the total market volumes over time, each bar being the next quarter on and the last data to June 2025. The dark green bars represent the branded volume and the light green bars represent the private label volume. The overall market moved up a little bit, 1% in total. But as you can see with the top line on the chart on the right, the private label growth continues to outperform the branded volume growth. Private label share has grown to 35.5%, up from around 30%, 3 to 5 years ago. And that would appear that line on the chart, which is that private label share has steadied and is holding now at these new high levels. And evidentially, if you look at other sectors like pet care, pet food, baby diapers, ice cream, private label share when it makes such a significant step change stays at these new levels. And we expect that to continue in the coming year. In the branded space in the last 12 months, we have seen a longer period of promotional activity from the brand typically in the spring time, and we haven't seen that for a few years now. There was some impact into our volumes and the market more generally during the end of what is our quarter 3, so February, March and into a bit into April. But since then, we have seen generally private label demand return to normal levels, solid and robust. In terms of categories, quite some differences in category penetration for private label. A key focus and strategic direction for us is laundry. Laundry is typically the highest value, highest margin part of the market. It's the least penetrated for private label, typically just under 30% for laundry, where you compare that to dishwash where penetration is 44%. Overall, we grew our volumes in private label just under 2% as was evident in the market as a whole. And we did particularly well in Dishwash, where we outperformed the market heavily. And in laundry liquid, which is a key priority and focus strategic area for us, we grew that business 7% against the market that grew 2.8%. So trends in the market are still favoring private label. We believe that they will hold at this level and our growth in the future will be coming from contract wins and growing our share in the existing customer base. Next slide, please. So just very quickly on our divisions. All these -- for your information, all these divisional divisions have their own management teams. We have a series of shared resources like purchasing and transportation and central finance and IT, for example. All other functions reside and are accountable within profit and loss accounts for each of these 5 divisions. Liquids is our biggest division, over 57% of the group. And we saw a good performance from the business this year, growing top line, moving up in contract manufacturing. We onboarded a significant new contract manufacturing contract in France. We've progressed strongly with our operational excellence agenda, driving lean approaches in manufacturing. And we continue to invest in automation and reduction of headcount through robotics and end-of-line automation. That business is cost oriented, by the way. You'll see each of these divisions has a strategic focus and the liquids is typically the most competitive environment. It's the lowest barriers to entry, cost leadership essential as a strategic focus for that division. Our unit dosing business is much more about product leadership. This is a fashion thing. You'll see frequent changes to formats. These are typically high priced on shelf. And we will work hard to lead in this space by driving new innovation, new formats all the time. Two new dishwash formats introduced in the last year, and we are now bringing to market the first soft dishwash fusion product, we call it into market right now. But actually, the performance improvement for unit dosings last year when you see the profit numbers was all about its operational performance. These are very difficult products to manufacture very fiddly, quite intricate machinery. We've had a fantastic step-up in output, waste reduction levels and labor efficiency through the factories. So great to see the progress that business, our most profitable business has performed last year. Very quickly on [indiscernible]. Laundry powders and dishwash powders is a declining market. So this is a -- this -- whilst it needs to be cost leadership, it's absolutely about specialism and expertise, a lot of work for sustainability on compacted products. So the days of 10-kilo boxes of laundry powder, you're now buying 1.5 kilo bags of laundry powder to do the same number of washes. That's very good for the carbon emissions and good for transport and everything else. And we've done a great job there, even though the market has declined slightly, strong delivery and margin expansion through operational performance improvements. And I'll quickly touch on Aerosols. This business was loss-making when we started the journey of divisionalizing this business last year. It's grown 21%. It's absolutely leading in its space, and we are very positive about the outlook for our aerosols business. Next slide, please. And I'll just touch now on our transformation program. So we launched this transformation program, we ran a series of what I call excellence projects about 2 years ago. And the outcome was to obviously try to drive value and drive benefits, and we targeted GBP 50 million across the 5 years from '23 to '28, but they're all around improving the platform that McBride has got. The backbone to this project is our SAP upgrade. We have -- we are currently an SAP customer. We have SAP across our division, but it's a 26-year-old SAP, and we are now migrating to the latest generation. A sort of multiyear project. It's the backbone really of our excellence agenda, standardizing processes, absolutely harmonizing the way we work across every location. And obviously, they're driving efficiencies, much more analytics, digital interfaces, AI experiences as well. So well on track. We have our first go-live in 1st of November. We're doing it on a very limited site-by-site basis. So we're not exposing the whole business to this at one go, but our first one is coming up in November, and we're very positive and in a good place on the rollout of that project. Our commercial and service excellence programs are actually now in the phase of closing out the project work streams and ready for handing back to the business as business as usual. We have made great progress with both these initiatives and time is right now to bed in the change they brought and continue to deliver on the benefits each are already showing. Our service performance statistics show the progress. We're up to 94%. That's the best in 6 years and our improved pricing and margin management, evidence of the commercial excellence program coming through in our results. As we go forward, we will see these full year benefits roll continuously into our results going forward. The expected benefits from SAP and our productivity program coming a little later in the 5 years, but we're also driving overhead efficiencies out. We removed 60 people at the end of the last year, financial year. People were underperforming. We have a rigorous assessment of individuals now and we've upped our game as part of that platform on our HR disciplines and HR processes, and we've cut costs, and we're driving overheads out by we drive performance across all aspects of the company. So that's my rapid overall business progress update. And hopefully, you've heard about -- not just about the financials, but also the strong all-around business that Bride now is and how we are set up for continued progress towards our midterm goals. I'm going to hand over to Mark now to cover off some of the financials. Mark Strickland: Thank you, Chris, and good afternoon, everyone. I'm pleased to have reported an excellent set of results for the financial year ended 30th of June 2025. As you'll see, the business has further strengthened its balance sheet, increased its liquidity and through the reinstatement of the accordion has further increased its optionality for future investment and capital allocation. As a result, I continue to have huge optimism for what the business can deliver for its shareholders into the future. So looking at the 2025 financial year in a little bit more detail. Whilst group revenues were down GBP 8.3 million or 0.9% on an actual basis, on a constant currency basis, they actually rose by 0.7% or GBP 6.5 million. Contract manufacturing, especially has helped this constant currency growth. As a business, we continue to look closely at forward -- sorry, closely analyze forward-looking raw material and packaging trends, adjusting sales margins accordingly. This, combined with close operational and overhead cost control means that at GBP 66.1 million, our adjusted operating profit has been maintained at similar levels to last year. Over the last 3 years, we have progressively strengthened our balance sheet through cash generation and debt reduction. For the 2025 financial year, our free cash flow was GBP 93.9 million, and our net debt further reduced ending the year at GBP 105.2 million. This gives the business a great platform for further investments in growth. Next slide, please. This slide looks at the group and divisional performance on both an actual and a constant currency basis. If we look at the left-hand side at the actual revenue figure, there were 2 notable impacts at play. Firstly, volume growth of GBP 39.5 million or 4.3%. This arose from new contract manufacturing volumes, continued private label volume growth and a significant growth in our aerosols business. The second impact was the price and mix effect of negative GBP 33 million. This is because there were more sales of lower value products in financial year '25 versus financial year '24. It should be noted, however, that though the selling price may be lower, the profitability is often similar to other products as these are also lower cost format products. I've included the tables on the right-hand side of this slide because of the significant impact of currency during the '25 financial year. I won't go through the detail, but this clearly illustrates the point that whilst at actual currency, both revenue and operating profit reduced slightly when looked at on a constant currency basis, in fact, both revenue and operating profit grew. Next slide, please. And in the interest of time and allowing questions, I'm actually going to skip over the divisional detail and move on through the divisional slides to Slide 18. If you can look at the divisional slides in detail, they just give a little bit more about each element of our business. So what I wanted to do is spend a little time on looking at costs. As you can see, input costs were broadly flat. So looking at the left-hand chart, costs broadly flat. But as you can also see, they remain significantly higher than back in 2021. Inflation is still prevalent and some costs are still rising, albeit at slower rates than over the last few years. This is why McBride's continuing focus on margin management has been key and will remain key to the delivery of another good set of results and similar results into the future. This consistency of performance means that McBride as a group remains very well placed to sustain and grow profits into future years. In terms of overheads, as you would expect, we continue our focus on cost optimization, and I deliberately talk of cost optimization, not cost reduction, as we will continue to spend in areas where we believe the returns and benefits of any expenditure exceed the actual cost increase. As with most businesses, technology remains a key focus and indeed, McBride is embracing new technology, believing that this will be a key positive differentiator going forward. Just some examples. We will shortly be going live with Wave 1 of S/4HANA, as Chris has said. We continue to invest into and benefit from our data analytics function. Again, a real-life example of this capability is some of the market analysis information that you saw in Chris' earlier section. We're also actively developing appropriate uses for AI across the business. Lastly, it would be remiss of me not to talk about distribution costs, which actually rose to 9.2% of revenue from 8.7% of revenue. This was actually as a result of the higher volumes we put through the business at the lower selling prices. So you had higher volume whilst revenue didn't necessarily increase. Next slide, please, Hannah. So looking at pensions. Year-on-year, the IAS 19 pension deficit decreased to GBP 24.9 million from GBP 29.4 million due to the deficit reduction contributions paid by the group, a lower value of liabilities and lower-than-expected inflation. The deficit is comprised of a U.K. defined benefit deficit of GBP 23 million and the post-employment benefit obligation outside of the U.K. of GBP 1.9 million. For information, the U.K. scheme is close to new members and future accrual. Within the U.K. scheme, contributions for the financial year '25 totaled GBP 7 million being made up of GBP 5.3 million of deficit reduction contributions and a one-off payment of GBP 1.7 million to remove the pension trustees' dividend matching mechanism, which was put in place a couple of years ago. That GBP 1.7 million is already paid back as without removing it, the trustees could have claimed that they could get GBP 5.3 million, which is the cost of the dividend. So for the price of GBP 1.7 million, we've avoided a GBP 5.3 million cost. The 31st of March 2024 triennial evaluation was agreed with the trustees during the year. And as part of that agreement, McBride has agreed future pension deficit reduction contributions of GBP 5.7 million to the end of FY '28, where upon they revert back to the previous profit-related mechanism. Turning to capital expenditure. At GBP 30.4 million, capital expenditure levels were above historic norms as the business invested in both its new SAP S/4HANA system and for future operational growth. It is expected that in FY '26, that will be the sort of level of expenditure, but then thereafter, it will drop back down to around the GBP 22 million to GBP 25 million as the SAP project comes to completion. Finally, on to net debt. As indicated at the start of my presentation, the business continues to generate strong cash flows and strong cash conversion, resulting in net debt falling to GBP 105.2 million. Additionally, the business has strong core liquidity with around GBP 141 million of headroom within its core facilities and an additional unutilized GBP 75 million -- EUR 75 million accordion facility. So it is well placed as well placed as it could be for both internal and external future expansion and investment. Next slide, please, Hannah. We flagged up in January that the Board intended to reinstate annual dividends -- and I am pleased to say that the Board is recommending 3p per share dividend for the 2025 financial year just ended. Hopefully, going forward, we may become increasingly accretive as a mix proposition share comprising capital appreciation combined with an income. As I said at the beginning of my presentation, I'm hugely optimistic for the future of the business. In the Capital Markets Day in March 2024, we set the business some challenging midterm targets. And as you have seen today, we are either already delivering on many of them or have made significant progress. My personal belief is that this set of results provides a further proof point that the business is definitely on the right track. Thank you, and I'll pass back to Chris. Christopher Ian Smith: Thank you, Mark. So look, just to wrap up in terms of an outlook. We never close to the end of our first quarter. And at this stage, we have seen a solid start to the year. Our volumes are absolutely in line with where we expected them to be. And we are seeing a good success rate in recent tenders, signaling further growth coming through from -- in our next -- in our second half of our next -- this current new financial year. We're now seeing great progress with our customer partnerships. That's evident in our win rates and that robust pipeline looking promising. The group will continue its mission on optimizing operational delivery and efficiencies, both in our day-to-day work, but also from the work from the transformation team, the transformation program, all supporting that midterm ambition of 10% EBITDA. And finally, with a strong balance sheet and financial flexibility now, the leadership team are looking at options for investment to support the midterm step-up in the group's scale and value creation opportunity for the benefit of all current and future shareholders. So that's it on the presentation, Hannah. So we're delighted to be able to take questions. Operator: Super. And we have a number. Right. Here we go. Cost pressures and margins. Are you able to add any detail as to how much of a threat to our operating margin are the cost-outs demanded by customers? Christopher Ian Smith: Look, it is always a feature of every conversation with any retailer, right, cost and price of product to retailers. It's not universal. We see very different conversations with different retailers. So please don't think every element of the market across all of Europe is identical. But we have -- part of our skill set, part of our capability is that ability to manipulate and manage product engineering to the benefit of both customers and ourselves. And unlike some other industries, like food, for example, if you could pick up a bottle of Tesco washing up liquid and a bottle of Sainsbury's and a bottle of Asda, and they all look the same, all the same site bottle and the same color. They are typically entirely chemically different. Every product is typically unique. We have that ability to flex formulations. It may affect performance. It may affect viscosity. It may have less perfume, more perfume. There are always ways to manage that. And look, it's an active part of the way we operate with our customers, and they will go through phases of want quality and they will go through phases of wanting cost. And that skill set, and Mark talked about it earlier, the focus on margin management to make sure that, yes, we can move prices and costs, but we're managing our margins and maintaining our margin. And look, there's been a lot of talk over the years about the ability of the power of the retailers into the supply side. In the crisis that we saw with the hyperinflation 3 years ago now, we recognize the -- we saw very clearly how important we are to our customers. There isn't anyone. Tesco honestly probably couldn't go anywhere else to do exactly everything we're doing. So you do have leverage. We do have arrangements with customers now for quarterly pricing reviews. It's not programmed. It's the right of both sides of a contract to ask the questions and challenge. But it protects our margins much better than before. Operator: And is the negative GBP 33 million price and mix effect on revenue entirely the result of the cost-outs demanded requested? Christopher Ian Smith: Not all. No. The mix side is not. Mix is that we do -- we -- part of the mix effect is actually the impact of the big contract manufacturing arrangement that we have with one of the world's biggest branders where we now 100% manufacture their bleach in the French market. Bleaches are low-priced commodity end product, but it's a stepping stone for us into a major relationship with a big brand. And the rest, yes, it's a bit of price give here and there, but we -- as you can see in the numbers, we've held our margins despite that. Mark Strickland: Just adding to that. So if a retailer says, look, we need you to get to a certain price point for a product, we may not supply the same product as they were getting before. We say, look, if you want us to meet a price point, then we are going to reengineer that product because we reserve the right to keep our margins. So it isn't just a like-for-like product and a reduction in the price. If there is a reduction in the price point, there is probably a reduction in the cost we put into that product. Therefore, we maintain our margins. Operator: Okay. Let's move on to cash flow and capital allocation. So you did a great job of bringing debt down. Do you foresee a decline of similar magnitude in the next period, given consensus forecasts are broadly flat? Or do you have other spending plans for the free cash flow? Mark Strickland: So a really good question and it is the right question. I think we focused on getting our balance sheet into a really good place. I think we're in a good place. That has now really given us optionality. We've obviously decided as a first step to pay dividends. But our capital allocation process is quite rigorous. And people have talked about share buybacks, about, well, do you want a progressive dividend? Do you want to do M&A? So we have a rigorous process. We have plenty of ideas as to what we might do. But we also have shareholder value accretion in our minds. And at any point in time, we'll take decisions based on what is available to us at the time. So if we carried on and did nothing, we would reduce debt further, but I'm not convinced that reducing debt further is the best use of our cash. There may be better uses. And again, that just depends how the year progresses and how opportunities come our way or don't come our way. But it's a really good question. Operator: Well, then as a natural segue, do you have a maintenance CapEx backlog? Or are you now able to fund growth CapEx? Mark Strickland: So I don't think we've ever really had a maintenance CapEx backlog. I think even when we constrained cash, we kept maintaining our equipment. I think it's always interesting whether CapEx is maintenance or growth because as your machines become older and you replace them, is that, in fact, maintenance CapEx? Or when you replace them, you tend to replace them with a machine that will do things quicker or cheaper, higher volumes, and that actually gives you growth and more ability to grow volume within your businesses. Now is that maintenance CapEx? Or is that growth CapEx? I think it's a little bit of both. But I don't believe our facilities are particularly starved with CapEx. I think they are appropriately invested. We also have quite a challenging approval system to make sure that we do invest in the right things. It's not free money. Christopher Ian Smith: I think just to add to that, we like to have a balance in the capital. It's not all about growth for stuff beyond pure maintenance. So there's some great opportunities for efficiencies. We talked about automation, end of line, removing labor from our cost structure. Cobots and robots don't ask for pay rises, right? And they don't go -- don't do industrial action or accident. So we see plenty of options and ideas coming from within the business. There are some great sources of high-quality, good value capital outside of the usual channels, which we're exploring to drive real value quickly, and we've done a few this last year. We'll do more. There's absolutely opportunity to drive margin improvement from CapEx automation as well as obviously from growth, which we will always continue to support. Operator: Okay. Just another quick one for you, probably, Mark. Can you tell us what estimate of WACC you're using to make decisions about what to do with free cash flow? Mark Strickland: So I actually use a different methodology. I'm from a private equity background, so I tend to work on payback. And my initial starting point is 2-year payback on stuff. Having said that, for the right things, we will do a longer payback. And for health and safety, you've just got to do health and safety. So I don't work on a WACC. I work on return on capital. We've said it's over 25%, but I also work on how quickly can we spin that cash. So can you get a payback quickly? So you're spinning the cash and utilizing it, very sort of private equity sort of approach to it. Operator: Okay. This individual has obviously seen the chaos that's been caused at the likes of M&S with their systems being hacked. Are you confident that won't happen to yourselves? And if so, why is that the case? Mark Strickland: Yes. So we concentrated on the shell. So we've put a lot of money into the shell to prevent people getting into our systems. However, we're now -- we switched from a prevention of attack to eventually somebody will get through. So it's not if, it's when. And if you change your attitude to, okay, somebody eventually will get lucky and get in because we've got to be lucky every minute, every second of every day to prevent and get in. So we spend a lot of money now on the inside of the shell as to how quickly we would detect somebody on the inside and also how we would shut segments of the systems down and how quickly we could get back up. So we're as confident as we can be. Until it's tested in anger, you're never 100% sure, but we have an awful lot of top expert advice. So we do have penetration testing. We have crisis management. We have simulations. Can I guarantee? I don't think anybody can guarantee, but I think we're in a reasonable place. Christopher Ian Smith: Compulsory training is the other thing. And the biggest risk is social engineering, isn't it? And so making sure all our teams, all our interfaces with systems are up to date on their training and is a key part of what we've been doing as well. Operator: Two questions on buybacks. Are you considering them? And if not, why not? Mark Strickland: It's part of the capital allocation consideration. At the moment, if you look at our share price, you would argue it's relatively good value and you could deliver value to shareholders by buyback. If you're not careful, that just concentrates the shareholder base even more. We did one about 4 years ago, and it didn't desperately move the share price. We also have a number of other ideas as to what we could do with it. But yes, it's not out of the question. But at this moment, we are just concentrated on paying the dividend. As I say, the balance sheet strength, you're absolutely right, gives us optionality, which is a nice place to be. Operator: Well, you raised it there, the share price question here around the frustrations that a lot of private investors feel that the current valuation put on the business. Why do you think you are so out of kilter from your peers? Christopher Ian Smith: Look, it is immensely frustrating. I mean we recognize that for all involved. I think the message we get -- the story we get is, look, concerns about 2022 happening again and concerns around -- which -- I know we should say the word unprecedented, no one likes that word. But I mean, we've never ever seen anything like that in my 11 years and in any of the history of the company before. It was all an outcome really of the consequence of supply chain post-COVID being chaotic and the ability to get chemicals and prices going up crazily. But the other fear is that sort of -- it's just going to go back to being a 3.5% to 4% business like it was for the 10 years probably running up to the COVID time. So we're super confident this business is not a 3% to 4% business. This is a 7% to 8% and an 8% to 10% business in EBITDA terms. We fundamentally believe the restructuring we've done, the way we've driven the organization design, our focus in the right markets. We have -- in the 5 years up to COVID, this business declined its volumes every single year. In the 5 years since we've grown them every single year. That's a testament to the way we now approach the customer, the way we operate with the customer. So we're firmly of the view that higher level sustainability levels of profits are there. The message is you've got to keep doing it to prove it. And so look, this is our second full year. It's 2.5 years because the year before that was -- we were coming out of the challenge in the second half was at these sorts of levels. We have got huge amounts of headroom. And in the last crisis, we entered that crisis, which is unprecedented. I mean we had [indiscernible] GBP 260 million, GBP 270 million of inflation on input costs in a 9-month period on a business that was making GBP 30 million of EBITDA. You can imagine how difficult that is to sort out, but we did. We've come through it. We've completely changed the relationships we have with our customers. And look, we can never predict whether there's going to be another macro crisis like that. But this business is an entirely different shaped business and a more resilient business. And we have got -- as Mark showed in the headroom, you can take a shock. We might take a shock for a quarter, but we have arrangements with customers that allow us to go back and challenge on price if that's clearly evident. And we spent a lot of time on raw material prediction indices. We're using data analytics. We're using all sorts of statistical processes to try to predict the forward views on ethylene, on natural products like natural alcohol and these sorts of things because that's super -- that's a major part of our proposition to customers is given that insight early. So I think the business is positioned well. It feels like we need to do more of it to prove to investors that this isn't a 3% to 4% business again. And we're sitting here with our targets. We've shown them today, second year in a run. We're looking -- the year forward is looking very similar, too. We hope to be better. And look, we're a staple product. Everybody needs toilet cleaner. They need to be able to wash the clothes. They need to clean the dishes. In consumer choice where they spend their money, we are a staple. And we're the biggest in Europe at doing it. and that sets us in a good position for the future. So look, we're just going to do more, and that valuation will come in time. Mark Strickland: Can I just add 2 things to that. I think in general, the small cap market is relatively unloved in the U.K. I think there's probably something Chris and myself can do more of. We've tended to be concentrated on to institutional investors, and this is our first attempt to reach out to the retail investors, and we need to engage, I think, more with the likes of yourselves. We've probably not got our message across into the retail community as well as we could do. This is our first step. And hopefully, we can engage more with investors like ourselves. Christopher Ian Smith: And just one last point. Although we call fast-moving consumer goods this space, it is actually slow moving consumer goods. I have to tell you this. Nothing changes dramatically overnight other than that crazy raw material situation, which has never happened before. The business doesn't line up around from this to that over time. It's really steady. We can predict it pretty well going forward. So it isn't -- although it's FMCG and everyone gets a bit panicky and jazz hands about the space, it is pretty steady. We are a great customer for our raw material suppliers. We're boringly tedious of buying the same amount of hypochlorite or PVC or whatever we might be buying from our suppliers. So it is a steady, solid business. It doesn't -- it's not going to change overnight. Operator: Okay. That was a really good explanation. Let's take a positive note. We've got a couple of questions here on growth. Given impressive service levels, where are the new opportunities and sort of aligned to that, are you making any progress on discounters because you were a little bit sort of underweighted, should we say? Christopher Ian Smith: Yes. Well, I love your question. Thank you. Look, we're very positive on the growth agenda. You've seen in the market data that the tailwind the industry has had for the last few years probably has steadied. There are pockets of difference within the overall market. But in general, the tailwind that we've had and the whole industry is probably steadied. It's holding at these new levels. So our growth in private label with the retailers is going to come from market share gains. I said earlier in my speech that we have made great progress in recent tenders. We've done very well with one of the -- our #1 customer is one of the worldwide brand. So discounters that you're probably thinking of begins with an A and letters along. That is our biggest customer. It's still no more than -- it's about 11% of the group. It's multi-country. It's not one single contract. And we just won loads more business at them as well. And they're a big partner customer for us. So we will gain share. That's the plan within our existing customer base. We didn't lose customers. You tend to lose SKUs or categories or ranges. We've never been kicked out really of any customer, but things move around a bit within the industry. So we're doing well, I think, in the retail, but we will just gain share. We have targeted areas like we talked strongly about laundry. We want to be #1 in the top -- we're #1 in the 5 countries of the big 5 countries in Europe, we're #1 in 3 of them, probably 4 actually just start to prove out at the moment, but we have gap in a fifth. So we've got opportunity to grow there. And then the other side is contract manufacturing. So we have a target of 25% of our revenues get to contract manufacturing. Why? 3 reasons really. One, it's load balancing. So it means we have a regular -- they're very reliable volumes in strategic long-term contract deals. It's a platform of volume through your factories, which cover overheads. Secondly, they are priced quarterly rigorously by the -- so it's absolute pass-through, and we will change the prices every month -- every quarter, sorry. But thirdly, relationships with the brands are important. We learn a lot from them. We help co-invest. We -- sorry, co-develop sometimes with branders. And they bring standards and insights that are helpful to our business model as well. So look, we think there's more opportunity. Reckitt recently have sold part of their household business. We think some of that may be available for contract manufacturing in the future. We would like to think we could participate in that. And we're now seeing increasingly a number of brands for peripheral operations where they don't have scale, for example, looking for outsourced partners, and we think we can grow strongly and get that ratio up in our total portfolio. So we're still very positive about growth. And as someone said, I think in the question, the platform that I talked about earlier around high-quality products, really strong service levels, good innovation, responsible development around sustainability, factories that you can walk around and be super proud of, safe environment. The platform is in good shape and customers like that. Operator: Great. The GBP 45 million of transformation benefits, how are they going to be distributed between each accounting period? And which KPI should we be looking at to see this effect? Mark Strickland: Yes. So it's GBP 50 million over -- the GBP 50 million cumulative over the 5 years. I think we'll see another GBP 5 million in the current financial year. So the benefit overall would be GBP 10 million, probably GBP 5 million the following year, which would make it GBP 15 million and then GBP 20 million in the final year. So it gradually ramps up. But if you add those all up, that gets you to your GBP 50 million. And it will come through a number of things. I mean how do you prove that you've got an extra penny on a bottle of bleach. We use a number of KPIs for commercial excellence and the benefit we get from that. So some you can directly measure such as overhead cost or OEE. Others such as commercial excellence, how do you measure the benefit from that it's derived from a number of KPIs. But it will come through things like margin, it will come through operating costs and it will come through overhead. Operator: And what about the cost of the SAP implementation, both capital and operating? And what are the expected benefits? Mark Strickland: So yes, that's a really good question. Again, the benefits are in part of the transformation and part of the transformation benefits. The overall project will be around GBP 27 million to GBP 30 million over -- it's over 4, 5 years. In terms of the benefits, the benefits should max out around GBP 15 million a year. Operator: Great. Will you allow me one more question? I have passed, but we've got a few more. You mentioned record output from factories, but obviously, we're seeing increasing costs in the U.K. from employment and obviously expensive in the EU as well. How do you allocate new business to factory? Is it purely a geographical consideration? Christopher Ian Smith: Yes. So typically, if you look at the product ranges that we -- the divisions are product-based, liquid products typically don't travel very well. I mean they do travel, but they're expensive. They're typically lower value per unit and the freight costs are quite high as a percentage of the total cost structure. So which is why our liquids factor is typically distributed around Europe to be more proximate to the end markets. So in those cases, for liquids choice, it's obvious which factory it's going to go to. It will be the one in the local area. When it comes to unit dose and powders, we make those centrally. They do travel well. The price points are higher. And it will depend -- our Danish plant for dishwash tablets is eco-certified. So if the Eco ranges, they will typically go there. And so often, it's driven by the sort of format of the product and what the capability of each site is. But we do load balance between the unit dose and powder sites, less so within the liquids. There's a bit of it. I won't -- I mean, for example, the German market is served by both our Polish plant in liquids, but also our Belgium plant. So there is a bit of load balancing and optimizing for cost and transport between those. But typically, it's pretty straightforward when we put the product. Operator: Great. And what are the branded companies doing in terms of promotion? Where are we in that cycle? Christopher Ian Smith: Yes. So if you look at the data, the price point, we look at data at a macro level across countries and by categories, pretty much across the board, the gap, I mentioned in my -- in that original speech, it typically branded products are twice the price of a private label. That gap has widened over the last 2 to 3 years. It's not necessarily narrowing at all at the moment. There are some exceptions, but broadly speaking, it's not narrowing. So the price gap is as big as ever. And what we're seeing with the brands, I would say, more than ever is we're seeing probably more on advertising. This is our perception, more promotional activity through advertising, through store placement, gondola ends, you're going to see Club card type promotions. And you'll see as well sort of fixture promotion where they'll decorate shelves and have gripping banners and arrows pointing at it. A little bit less on the pricing than we thought. So I think they're experimenting. It's not -- again, it's a very big generalization, please. So it may be completely wrong on any particular case. But that would be the general feeling. I think the price points are not coming down on average. We see the gap held. So therefore, by definition, it's not price investment that we're seeing in promotion and advertising. Operator: Well, listen, thank you. I know you've got to get off to our next meeting. So thank you very much for your time today to our audience for joining us. Apologies if we didn't get through to your question. I will try and send the extra ones over to management, and we can come back to you. But that leaves me to say we look forward to hearing an update in 6 months' time. Christopher Ian Smith: Great. Thanks, very appreciate it. Thank you. Mark Strickland: Thank you.
Operator: Greetings, and welcome to the Darden Fiscal Year 2026 First Quarter Earnings Conference Call. [Operator Instructions] This conference is being recorded. [Operator Instructions] I'll now turn the call over to Ms. Courtney Aquilla. Thank you. You may begin. Courtney Aquilla: Thank you, Kevin. Good morning, everyone, and thank you for participating on today's call. Joining me are Rick Cardenas, Darden's President and CEO; and Raj Vennam, CFO. As a reminder, comments made during this call will include forward-looking statements as defined in the Private Securities Litigation Reform Act of 1995. These statements are subject to risks and uncertainties that could cause actual results to differ materially from our expectations and projections. Those risks are described in the company's press release, which was distributed this morning, and in its filings with the Securities and Exchange Commission. We are simultaneously broadcasting a presentation during this call, which is posted in the Investor Relations section of our website at darden.com. Today's discussion and presentation include certain non-GAAP measurements, and reconciliations of these measurements are included in the presentation. Looking ahead, we plan to release fiscal 2026 second quarter earnings on Thursday, December 18, before the market opens, followed by a conference call. During today's call, I'll reference to the industry Chuy's results refer to Black Box Intelligence Casual Dining Benchmark, excluding Darden. During our fiscal first quarter, average same-restaurant sales for the industry grew 5% and average same-restaurant guest counts grew 2.6%. Additionally, due to the continued divergence between average and median results, we are sharing that median same-restaurant sales for the industry grew 3.3% and median same-restaurant guest counts grew 1.3%. This morning, Rick will share some brief remarks on the quarter, and Raj will provide details on our first quarter and share our updated fiscal 2026 financial outlook. Now I will turn the call over to Rick. Ricardo Cardenas: Thank you, Courtney, and good morning, everyone. We had a great quarter with same-restaurant sales and earnings growth that exceeded our expectations. For the first quarter, 3 of our 4 segments generated positive same-restaurant sales and traffic growth. The strength of our results is a testament to the power of our strategy. Across our portfolio, our restaurant teams remain focused on being brilliant with the basics through culinary innovation and execution, attentive service and an engaging atmosphere, all enabled by our people. And at the Darden level, we continue to strengthen and leverage our 4 competitive advantages of significant scale, extensive data and insights, rigorous strategic planning and the quality of our employees to further position our brands for long-term success. Olive Garden same-restaurant sales grew 5.9%, driven by compelling food news and the continued growth of first-party delivery. Early in the quarter, Olive Garden's marketing highlighted their Create Your Own Pasta platform from the core menu. Their television creative featured a new Spicy 3-Meat Sauce and Bucatini pasta starting at $12.99. This new sauce taps into guest evolving tastes for bolder, more flavorful offerings. It was well received and helped drive a significant increase in preference for the Create Your Own Pasta platform. Olive Garden built on the momentum of bold and spicy flavors by debuting Calabrian Steak and Shrimp Bucatini for a limited time during the quarter. The dish exceeded expectations and quickly became a new guest favorite, ranking among the top 10 entrees for preference. First-party delivery through our partnership with Uber Direct is helping capture younger, and more affluent guests who value convenience and crave Olive Garden. This represents a significant incremental opportunity for the brand as these guests have a higher check average and typically do not use Olive Garden for an in-restaurant dining occasion. Olive Garden's advertising featuring 1 million free deliveries concluded in the first quarter with all the free deliveries being redeemed. Average weekly deliveries doubled throughout the campaign. Following the campaign, delivery order volume has remained approximately 40% above the pre-campaign average. The team will continue to promote delivery across a number of channels. On our last call, we talked about putting a greater emphasis on sales growth and reinvesting to drive long-term growth. One of the ways we're doing this at Olive Garden is by strengthening affordability on the menu to give guests more variety at approachable price points. During the quarter, Olive Garden began testing a lighter portion section of the menu, featuring 7 of their existing entrees with reduced portions and a reduced price. These items available at dinner and all day during the weekend still offer abundant portions and come with Olive Gardens never-ending first course of unlimited Breadsticks and unlimited soup or salad. 40% of Olive Garden restaurants currently offer this menu and the initial response from guests has been encouraging, with affordability scores increasing 15 percentage points and high satisfaction with portion size. I have confidence in Olive Garden's initiatives for the year as well as their 5-year road map to sustain long-term growth and success. LongHorn Steakhouse grew same-restaurant sales by 5.5%, driven by continued adherence to their strategy rooted in quality, simplicity and culture. The team continues to raise the bar in food quality by consistently executing every dish on their menu to their high standards. This is reflected by LongHorn's #1 ranking among casual dining brands -- major casual dining brands within Technomic industry tracking tool for food quality, service, atmosphere and value. I'm really proud of the operational consistency at LongHorn and the work the team is doing to maintain their momentum. Same-restaurant sales for our Other Business segment grew 3.3% during the quarter, driven by strong performance at Yard House, Cheddar's Scratch Kitchen and Seasons 52. During the quarter, Yard House strengthened their competitive advantage of distinctive culinary offerings with broad appeal by enhancing their taco platform with higher-quality ingredients and more options for guests. As they have seen with similar investments in their burger and pizza platforms, this resulted in higher preference and guest satisfaction. To help strengthen their competitive advantage of a socially energized bar, Yard House held its third annual Best On Tap Competition during the quarter. What began as a test of knowledge and hospitality skills has grown into a cornerstone of the Yard House culture where every bar tender competes. Congratulations to this year's winner, Michelle Younes from the Yard House at City Center in Houston, Texas. The Cheddar's team leverages efficiency and Darden's purchasing power to provide great food served at a wow price. During the quarter, they introduced a Hawaiian sirloin, a center cut top sirloin finished with pineapple and a sweet Hawaiian glaze, starting at $16.49. This limited time offer also included a Honey Butter Croissant and 2 sides for that price. In Technomic most recent survey, Cheddar's ranked first among casual dining brands for both price and affordability. During the quarter, Cheddar's also saw strong off-premise sales growth driven by first-party delivery. Off-premise sales grew 15% during the quarter, and the Cheddar's team will continue to promote delivery through owned and digital channels as well as in restaurants. Same-restaurant sales for the Fine Dining segment was slightly negative for the quarter, but I'm encouraged by the actions each of our Fine Dining brands are taking to address the softness. For example, in the current environment, more guests are seeking price certainty, and Ruth's Chris Steakhouse introduced a 5-week limited time offer featuring a 3-course menu that drove positive comps for the quarter. For $55, guests could select 1 of 3 entrees as well as a super salad, an individual side and dessert. The offer was well received with strong guest preference and sales lift. Now I want to share a quick update on the sale of 8 Olive Garden locations in Canada that I referenced during our last call. On July 14, we closed on the sale of those locations to Recipe Unlimited, the largest full-service operator in Canada. At closing, we also entered into an area development agreement with Recipe Unlimited to open 30 more Olive Garden's over the next 10 years, 5 of which have already been approved. Our franchising team is focused on growing our global presence. Today we have 163 franchise locations, which includes 63 in the Continental United States and 100 outside the Continental U.S. Last month, we held our annual leadership conference, which provides a powerful way for us to engage with every general manager and managing partner across our brands, celebrate past performance and align on key operational priorities. This was also an opportunity for these restaurant leaders to learn about their brand's 5-year business plan and understand what they need to do to win today and into 2030. The opportunity to interact with this talented group of operators is one of the highlights of the year. I came away energized by the level of engagement and passion on display, which further reinforced the results of our most recent engagement survey, a new all-time high for Darden. Overall, I am pleased with the strong start to our new fiscal year. Our strategy is working, enabling us to grow sales and take market share while meaningful -- making meaningful investments in our business and returning capital to our shareholders. Beyond that, we have a larger purpose at Darden: to nourish and delight everyone we serve. One of the ways we do this is by fighting hunger. Once again this year, Darden is helping Feeding America add refrigerated trucks for 9 member food banks. With the addition of these new trucks, the Darden Foundation, with support from our partner, Penske Truck Leasing, has funded more than 50 vehicles to meet the increasing demand for food assistance in communities where we operate. Our philanthropic giving would not be possible without the efforts of our 200,000 team members and their passion to nourish and delight our guests and communities. Thank you for all you do. Now I'll turn it over to Raj. Rajesh Vennam: Thank you, Rick, and good morning, everyone. The first quarter was another strong quarter for Darden. Sales and earnings growth exceeded our expectations as our sales momentum from the fourth quarter continued into the first quarter. This strong top line sales growth and our significant scale provide us with the opportunity to keep a long-term perspective and continue investing in our business. In addition to the menu investments Rick mentioned, the largest investment we made over the past several years is pricing below total inflation. During the first quarter, our pricing was 30 basis points below inflation. We generated $3 billion of total sales, 10% higher than last year, driven by same-restaurant sales growth of 4.7%, the acquisition of 103 Chuy's restaurants and the addition of 22 net new restaurants. Both our same-restaurant sales and same-restaurant guest counts for the quarter were in the top quartile of the industry. Adjusted diluted net earnings per share from continuing operations of $1.97 were 12.6% higher than last year. We generated $439 million of adjusted EBITDA and returned $358 million to our shareholders this quarter by paying $175 million in dividends and repurchasing $183 million in shares. Now looking at our adjusted margin analysis compared to last year. Food and beverage expenses were 20 basis points lower, driven by pricing leverage as commodities inflation was approximately 1.5% for the quarter. Restaurant labor was 20 basis points unfavorable as a result of high performance-based compensation expense, including a higher 401(k) match for our restaurant teams. Total labor inflation of 3.1% was fully offset by pricing of 2.2% and productivity improvements. Restaurant expenses were 10 basis points higher as sales leverage was more than offset by Uber Direct fees and the brand mix with the addition of Chuy's. Marketing expenses were flat as cost savings in marketing helped fund additional marketing activity in the quarter. This resulted in restaurant-level EBITDA of 18.9%, 10 basis points lower than last year. Adjusted G&A expenses were 30 basis points favorable. Synergies from the acquisition and leverage from sales growth were partially offset by unfavorable mark-to-market expense on our deferred compensation. Due to the way we hedge mark-to-market expense, this unfavorability is fully offset in the tax line. Interest expense increased 10 basis points due to the financing expenses related to the Chuy's acquisition. Our adjusted effective tax rate for the quarter was 10.5%, helped by the mark-to-market hedge I mentioned earlier. Our effective tax rate would have been approximately 12.5% without this impact. In total, we generated $231 million in adjusted earnings from continuing operations, which was 7.6% of sales. Looking at our segments for the quarter. Total sales for Olive Garden increased by 7.6%, driven by strong same-restaurant sales and traffic growth. The sales from the addition of 18 new restaurants more than offset the sales loss from the refranchising of 8 Canadian restaurants. Their sales momentum continued from the prior quarter with same-restaurant sales in the top decile of the industry and outperforming the industry benchmark by 90 basis points. Olive Garden delivered a strong segment profit margin of 20.6% for the quarter, which was only 10 basis points below last year, even with the investments in affordability and the impact of delivery fees. At LongHorn, total sales increased 8.8%, driven by same-restaurant sales growth of 5.5% and the addition of 18 new restaurants. The sustained sales and traffic outperformance resulted in same-restaurant sales in the top quartile of the industry for the 13th consecutive quarter, with this quarter ranking in the top decile. The LongHorn team is doing a great job of staying focused on their strategy and maintaining momentum within the business despite continued cost pressures. Higher-than-expected beef cost towards the end of the quarter and pricing below total inflation of approximately 100 basis points resulted in segment profit margin of 17.4%, 60 basis points below last year. Total sales at the Fine Dining segment increased 2.7%, driven by the addition of 5 net new restaurants. While same-restaurant sales for the segment were slightly negative, the strong performance of the limited time offer at Ruth's Chris helped to offset the continued challenges within the Fine Dining category. Overall, segment profit margin was lower than last year. The Other Business segment sales increased 22.5% with the acquisition of Chuy's and positive same-restaurant sales of 3.3%. The positive sales momentum and continued productivity improvements in multiple brands within the segment resulted in segment profit margin of 16.1%, 90 basis points higher than last year. Now turning to our financial outlook for fiscal 2026. This morning, we updated a few items in our guidance, taking into consideration actual performance year-to-date and the evolving commodities outlook for the remainder of the fiscal year. We are raising our expected total sales growth and tightening the range of same-restaurant sales to reflect the outperformance in the first quarter, acceleration in our new unit pipeline and any incremental pricing we may take to partially offset the additional commodities costs. We now expect total sales growth of -- for the year of 7.5% to 8.5%, same-restaurant sales growth of 2.5% to 3.5%, approximately 65 new restaurant openings and total inflation of 3% to 3.5% with commodities inflation of 3% to 4%. All other aspects of our guidance remain unchanged, including adjusted diluted net earnings per share between $10.50 and $10.70. While we are reiterating our full year earnings per share guidance, we expect the lowest year-over-year EPS growth to be in the second quarter, driven by the significant step-up in beef costs and our measured approach to pricing for these costs. We expect our pricing for the second quarter to be approximately 100 basis points below total inflation. We have a proven track record of successfully navigating through higher costs, and we'll continue to take a disciplined approach to ensure the long-term health of our business. We believe our strategy remains the right one for our company. Now we'll take your questions. Operator: [Operator Instructions] Our first question today is coming from Brian Harbour from Morgan Stanley. Brian Harbour: Maybe just on that last point first, Raj, could you talk about sort of contracting through the balance of the year and sort of what gives you visibility that you've kind of encompassed the range of food cost outcomes? Rajesh Vennam: Yes, Brian, I think if you look at what we published this morning, we -- our coverage is less than typical, especially in beef. Right now, we only have about 25% coverage in beef for the next 6 months. And that's one of the biggest opportunities in terms of where we're seeing the biggest headwinds. And I think as you all know, there's been a significant spike in beef costs recently, especially tenders and rebuys, so -- and we don't believe these price levels are sustainable, and that's why we don't have as much coverage, and that's part of the reason. And given the significant price increase, there are -- we are starting to see some demand disruption in retail. So I guess, really the big picture, beef is the biggest variable here. And then the other component here where you're seeing a higher inflation is on seafood, primarily due to the tariffs on shrimp. And our team is working through to figure out how to mitigate some of that. And that's really the reason why we're taking the inflation up from 2.5% at the beginning of the year to now 3% to 4%. But this situation is still very fluid here. Brian Harbour: Rick, maybe just on the comments about sort of the new portion sizes at Olive Garden. What -- are you seeing sort of a different guest that is asking for that? Do you think this is actually sort of a traffic driver for Olive Garden? Or I guess, on the other hand, do you think this is check dilutive in some sense? Like how are people actually sort of approaching that? What are you seeing from those items? Ricardo Cardenas: Yes, Brian, it's still pretty early. We do believe in the long run, this is a traffic driver. It will dilute our check a little bit if people trade from a higher portion size item to a lower portion size item. But we believe that's the portion that those guests want. And it's very early indications are that we're seeing a little bit more frequency. But it's not necessarily new guests because we haven't marketed it, and we put it in restaurant without even any fanfare and it's just people are gravitating towards that. It's not significant preference gravitating towards it, but there is some preference moving there. Operator: Next question is coming from Jon Tower from Citi. Jon Tower: Great. Maybe kind of in the same vein, that -- the affordability pivot and -- this quarter as well as the Uber Eats amplification or build in the quarter. Can you maybe speak to how that hit on the cost line during the period? And I noticed that, obviously, the restaurant margin, you didn't lever that as much on a pretty solid comp in the period. So maybe, Raj, if you could speak to those costs during the period and what you're expecting going forward as well. Rajesh Vennam: Yes, Jon, let me first start by saying these are things we planned on and we had in our plan. And I think we said -- that's why we said we're actually exceeding our plan. And it's actually -- the fact that the segment profit margin is only down 10%, they're still north of 20%, is a testament to the strength of the business model at Olive Garden. Now with that said, let me explain a little bit more detail. First of all, we still priced below total inflation. Olive Garden's pricing was only 1.9%. So that's a pretty low price in this environment given that, again, the total inflation. Second, specific to those 2 items, they were roughly on the margin, if you just purely look at the margin percentage impact, they are probably about 20 basis points each. So if you put that back, I mean, we would have been positive 30, right? But that's, again, even with pricing below inflation. So I think that's sort of a key metric that we need to take into consideration because we believe, long term, these are the right decisions we're making. And I think any business would envy a 20-plus segment profit margin. Jon Tower: And then maybe just drilling a little bit more into the delivery business at Olive Garden. Can you talk about -- Rick, you had mentioned that you're pleased with how, obviously, you're seeing younger guests make their way in, more affluent. Can you give us any more information on the frequency of those guests? Are they coming more so than what you're seeing within the store in terms of frequency and how they're using it even, obviously, it hasn't been a year yet, but seasonally, how they're maybe using that channel relative to in store? Ricardo Cardenas: Yes, Jon. We've said -- as we said in the past, we are getting higher frequency for delivery guests than we are in dining guests. It's still early. We haven't had the delivery for a year yet, as you mentioned. As to seasonality, the one thing that Uber told us is normally, over the summer, delivery orders start to kind of fall off. And we really hadn't seen that. So we'll know a little bit more about the seasonality of delivery after we've passed a year or maybe even 2 years, because it continues to grow for us. That said, we're very excited about how delivery is going. And as Raj mentioned earlier, we are using some of that extra guest count and extra margin to invest for all guests, and we feel really good about that for the long term. Operator: Next question is coming from David Palmer from Evercore ISI. David Palmer: Aside from the beef cost question, I think there's probably 2 areas that are major areas of curiosity, and I certainly share them. And one is the strong performance of the casual dining segment, which is becoming increasingly unusual after fast casual has slowed through the year, through the middle of this year. And another, I think, is Olive Garden against more difficult comparisons later in your fiscal year. How will it do and what are you lining up against that? So those are really my 2 questions. What are your thoughts about why casual dining is doing as well? And do you think that will continue? And then separately, Olive Garden, you're rolling out a pretty large test on small portions, but what are your thoughts? And what are you kind of lining up to keep the momentum going as you get into lapping some of the good stuff you've been doing in the last 3 or 4 months? Ricardo Cardenas: Yes, David. I believe the strong casual dining segment is driven by, generally, less pricing than other segments of dining, for the segment itself, for casual dining itself. And for the larger players in casual dining, even lower pricing than casual dining total. So there's -- the guests are starting to see the value that casual dining brings. Now we've been seeing that for a few years now, as you know, it's just others are kind of following in line with that, and we're seeing that the guests see the value. Also, when they're trying to figure out where they spend their money, they're going to places where they can connect and engage with their friends and family. There may be less snacking going on and less kind of munching, but when people are going out to eat, they're going out to where they can feel they can get a great meal at a great value and have time with their friends. In regards to Olive Garden for the back half of the year, we have plans to continue the momentum. We do know that the comparisons get a little bit more challenging. But the Olive Garden team is working on things that we could do in the back half of the year. We've got a great plan. We do believe that, over time, the affordability items on the menu, the lighter portion -- I don't want to call them affordability. They're the right portion size for the right price for a group of consumers, that will eventually drive more traffic. It might not drive it in the back half of the year because we're not talking about it yet. That said, we may start talking about it in the back half of the year. So there's a lot of things that we're going to do. We've got a great team. And we'll react to whatever the sales trends look like at Olive Garden, and we'll go from there. Operator: Next question is coming from Jim Salera from Stephens. James Salera: I was hoping you could give us a breakdown on LongHorn, just the comp split between traffic and ticket. And then as a follow-up on that, have you seen any increased engagement with consumer -- you mentioned, obviously, pricing 100 basis points below inflation. Should we kind of expect that similar gap to progress through the year? Or any thoughts around how we should expect pricing to trend? Rajesh Vennam: Yes. So let's start with the LongHorn traffic versus -- LongHorn traffic was up about 3.2% for the quarter. The same-restaurant sales were 5.5%. So the check was 2.3%. Their pricing was 2.5%. They had a little bit of a negative mix, primarily [indiscernible], of 20 basis points. In terms of pricing versus inflation, at LongHorn, as we said, we -- there was a bigger spike in beef prices. That was a little bit of a surprise at the end of the quarter. But we also had planned on having some gap to pricing. So it further widened, I guess, by the time we ended the quarter, a little bit. As we look through the year, we expect second quarter, at the Darden level, without getting specific segment level here. At the Darden level, we expect pricing to be about 100 basis points below inflation, and we expect that gap to narrow as we go through the year. And so you would expect the pressures on the margin to be -- kind of follow that, right? So we probably have the biggest gap in Q2, maybe cut that in half by the time you get to Q3 and then try to narrow that further as we get to Q4. But consistent with our philosophy, our pricing for the full year will probably be -- we'll end up being below inflation. Is it going to be 30% or 50%? I don't know. We're working through that. I think our -- we've been always very thoughtful about what cost do we actually price for. And we don't want to price for temporary costs. We want to price for, over time, find other ways to solve for these incremental costs. And that's what our team is focused on. James Salera: Great. And then you guys mentioned the value-focused menu expansion at Olive Garden. Is that something that we could see maybe in a more limited fashion at LongHorn as well, maybe focus on like appetizers or smaller plate items? Or is that something that right now it's just Olive Garden focused? Ricardo Cardenas: Yes. We're doing this at Olive Garden to see how that works out. And if other brands think that it makes sense for them and they get the learnings from Olive Garden, maybe they will implement. But right now, the focus is the Olive Garden and it's the Olive Garden team that's driving it. And as I said, we'll see how that goes. Now there might be some things that LongHorn does in the future or other brands do in the future, but they'll make those decisions as those times come. Operator: Next question is coming from Eric Gonzalez from KeyBanc Capital Markets. Eric Gonzalez: Just a few quarters ago, you talked about some strength among the lower income consumers. Obviously, most of your peers, particularly on the fast food side, are talking about weakness among that cohort of income. So if you maybe you could talk about what you're seeing from an income perspective, and are you gaining share among lower-income consumers? Do you think that part of the equation is actually holding yourselves up relative to your peers? And are you seeing some maybe trade into the category from some of the higher-income folks, particularly on the casual dining side? Ricardo Cardenas: Yes, Eric, specific to casual dining, all our casual dining brands saw an increase in visits year-over-year from guests across all income groups, but specifically those in higher income groups. So you would expect that would have been -- that could have been some trade down, but it could be trade up from a lower income group to a great value in casual dining. We are seeing a few shifts in behavior and that guests are going towards what price certainty, so they know what they're going to pay before they come in, or greater perceived value even if the item is a high price. So if you think about the Calabrian Steak and Shrimp that we had at Olive Garden, great preference, great perceived value. It was the highest priced menu item on the menu. But we are seeing, as I said, for casual dining brands, growth among all income groups. Eric Gonzalez: Great. And then on the -- just to close the loop on the commodity discussion. Based on where the commodities are now and what you've locked in, I know you're a little bit lighter on the beef side, what do you think that implies for store-level margins? And what's embedded in the guidance? In the past, you talked about modest margin expansion you still think you can get there based on what you did in the first quarter and where you are locked in. Rajesh Vennam: Eric, I would refer you back to our long-term framework, which basically talks about our earnings after tax from 0 to 20 basis points growth. So if you look at our guidance, even at the low end, we're basically either flat or growing margin at the Eat level. We don't want to focus too much on any one line item, and for us, ultimately, if we're able to achieve our long-term framework and get the targets we want to get to by investing more in the guest, we want to do that. If that means that the segment profit margins are down year-over-year, that's not something we're concerned about. I think our focus ultimately is on -- at the Eat level, at the earnings after tax level, are we staying flat or growing margins? And that's -- we feel like we're still on a path to get there. Operator: Next question today is coming from David Tarantino from Baird. David Tarantino: Rick, I had a question about your views on the overall health of the consumer spending environment. Certainly, you had a great quarter. But I guess over the last few months, we've seen a lot of crosscurrents related to the job updates and whatnot. So I'm just maybe wanting to get your thoughts on where we are from the state of consumer spending and whether you think anything's changed recently relative to maybe where you thought it was at the start of the year. Ricardo Cardenas: Yes, David, I can't say that anything has changed dramatically from where we saw it at the start of the year. We are ahead of where we thought we'd be right now. There's a lot of talk about the job revisions, but those jobs didn't exist. So that's what people were working. And so we're dealing with what was actually happening, not what was thought to be happening. And so I believe that the August retail sales were up pretty significantly, and we had a pretty darn good August too. So I don't see any dramatic change to what we thought the consumer was. David Tarantino: Great. And Raj, one quick clarification. You mentioned the inflation versus pricing gap is expected to narrow as you get into maybe the second half of the year. Is that because of the price components going higher or the inflation components coming down? I guess, could you explain kind of how that might work? Rajesh Vennam: Yes. Sure, David. It's primarily the -- we are taking a little bit more price as we go through the year. We mentioned that at the beginning of the year, right? We started pretty low in the first quarter. We expect to get for the full year to be in the mid- to high 2s. And we started with 2.2, as you can see, as the year progresses, that moves up a little bit. And then there's also some near-term pressures that we expect, because like I said in the commentary around beef, we don't think all these high prices are sustainable. I mean these are pretty punitive to the consumer, and we're trying to protect them by not pricing for it. Operator: Next question is coming from Sara Senatore from Bank of America. Sara Senatore: I wanted to ask about the idea of sort of investing and growing top line, more of a top line-driven growth algorithm. You mentioned pricing below inflation and, obviously, affordability is something that your brands are known for in terms of value for the money. But I guess I could also characterize marketing as a way to do that or even perhaps subsidizing delivery fees. So I was just curious, as you think about the kind of different investments, is marketing something -- I know you said you got some leverage, so marketing dollars were higher though, perhaps a little bit light of what we might have expected. And you talked about delivery fees as perhaps margin pressure. So I wasn't sure if that's because you're not fully covering them with what you charge your customers. But perhaps you could -- and I know it's free delivery this quarter, so perhaps that's an exception. But maybe you could talk a little bit about as you think about investing behind top line, these other possible ways to do that. And then I do have another quick follow-up. Ricardo Cardenas: Yes, Sara, we do believe that marketing can help drive traffic. And while our marketing as a percent of sales didn't seem to grow, I think Raj mentioned in the prepared remarks, we had some cost saves in marketing that offset our actual marketing growth. So we actually had more TRPs out there, our other brands that are not on linear TV or testing connected television and other digital aspects, Cheddar's has their first ever 30-second commercial on a connected television. So we are increasing our marketing activity because we believe that will drive some traffic. But we're not doing it at deep discounting in the ways that we had done it in the past. And you did -- I think you answered your question on the delivery fees. There are other ways that we can do things to drive delivery. But this quarter, the 1 million free deliveries did impact a little bit of the margin. Sara Senatore: Great. And then just the follow-up was, I think, Rick, you alluded to less snacking or munching. I was curious, is that like a GLP-1 reference in terms of like how people are changing their eating patterns? Or was it more people are prepared to give up some of these sort of convenience or impulse occasions and spend behind really good experiences like they get at Olive Garden or LongHorn or your other brands? Ricardo Cardenas: Yes, I think it's a little bit of both. There are some people on GLP-1s that when you do the research on them, they eat smaller portions or they eat out a little less, but when they eat out, they actually eat out more in casual dining. And so there is a little bit of that. But I think it's maybe even a consumer that says, "I'm just trying to be healthier or eat a little less." And so maybe there is a little less snacking. And at the lower end consumer, they probably don't have as much resource to go out as much as they did, and it's probably impacting another category more than it is impacting us. Operator: Next question today is coming from Jeffrey Bernstein from Barclays. Jeffrey Bernstein: Great. Rick, for fiscal '26, you raised your comp guide modestly. But clearly, that's in spite of maybe what many people expected, a slightly tougher macro and concerns of a consumer slowdown, and we know about the tougher compares. I think you mentioned the first quarter was modestly above your plan. But any color you could share on your confidence in raising that guide? And as we think about the current fiscal 2Q, the compares are definitely much tougher. I know, last quarter, you were willing to frame kind of what you expected for the current quarter versus your full year guide, wondering whether you think the fiscal second quarter will come in above or below kind of that new range. And then I had one follow-up. Ricardo Cardenas: Yes, Jeff, I'll start by saying we wouldn't have increased our guidance if we didn't feel confident about it. So as we look at our same-restaurant sales and our total sales -- part of the reason we raised our total sales is we're really confident in our unit count in development. We increased the number of -- well, we got rid of the low end of our range for development and we say now we're approximately 65, partly because we are -- most of the restaurants are either built or being built or open already, and some of them are coming in earlier than we thought. So we feel really good about our development pipeline. And I'll let Raj talk about the cadence of our comp, but -- for the second quarter and beyond. Rajesh Vennam: Yes, Jeff, I'd say, look, we expected as we went into the year for the back half to be not as strong in comps as the first half. But I think as the year is progressing, we're learning more and we feel really good about how even the second quarter started off, and that's all taken into consideration as we provided this guidance. But I think ultimately, the cadence will still be the fact that we still expect the back half to be lower than the first half. Jeffrey Bernstein: Understood. And then just a follow-up on your Uber partnership. I know it's still early, but it seems like you're having success with Olive Garden and Cheddar's with the 1P. I'm just wondering, first, whether you'd consider a next brand to embrace that 1P Uber delivery and whether there's any updated thoughts on potential for using Uber for the order aggregation part of things, not just delivery. Ricardo Cardenas: Yes, Jeff. We are pleased with our first-party delivery, both at Olive Garden and at Cheddar's. It continues to grow for us. We do have another brand that's wanting to embrace it, and we would expect that brand to be on the platform sometime in Q3. I won't tell you what brand that is, but they're very excited to jump into the first-party delivery. In regards to marketplace or third party, whether it's Uber or anyone else, we still have some challenges with the model. We're focused on first party right now. And we've talked about the things that we don't like about third party. If a provider can come with every solution that we have for third party or the reasons that we don't like it, then we would definitely consider it. But right now, we're very comfortable and very pleased with how first-party delivery is going. Operator: Next question is coming from Jacob Aiken-Phillips from Melius Research. Jacob Aiken-Phillips: Yes, I first wanted to double back on unit growth acceleration over like the medium to long term. I know you took away the lower end. Just how should we think about that ramping up, especially with -- I know there's some new prototypes, there's some acceleration in Canada and a couple of moving parts? Ricardo Cardenas: Yes. The development is our owned restaurants, so 65 of our restaurants. Canada is all franchised, so that doesn't count in our unit growth. We get a lot of good royalties from that, but that doesn't -- isn't a unit for us. In regards to how we're going to ramp up our, 5-year plan, has us solidly in our long-term framework of 3% to 4% of our sales growth coming from new units. And so you would expect our unit growth percentage to ramp up a little bit year-over-year. Jacob Aiken-Phillips: Great. And then just on -- I know that there were like some prototypes of like smaller, but then also some competitors are saying they're seeing some higher construction costs from like imported stuff. Any comments there? Ricardo Cardenas: Yes. We've got a couple of brands -- actually, all of our brands, especially Olive Garden and LongHorn, over years, worked on the right prototype size. Yard House and Cheddar's have just come out with new prototypes that are smaller, much more efficient and the costs are lower than it would be for building our existing prototype-size restaurants. And we've opened a few of them and they're doing really well and they're able to generate the sales that our existing prototypes are generating in general. In regards to costs, our costs are much closer and actually sometimes under our budgeted amounts, which is very different than it was before. Tariff impacts, we don't believe, are too dramatic to construction costs. And so we feel really confident about our pipeline and being able to build them at a very good return for us. Operator: Next question is coming from Jake Bartlett from Truist Securities. Jake Bartlett: My first one is on delivery. I'm hoping you can frame the mix that delivery was in the first quarter, but also what the exit rate was after the promotion. Also, whether you expect to promote similar promotions in the -- as we go forward in '26. And then I have a follow-up. Ricardo Cardenas: Yes, Jake, I'll speak specifically to Olive Garden. I think that's what you're asking for. So for Olive Garden delivery in the first quarter was about 5%. We exited at about 4%. As we mentioned, when we stopped 1 million free deliveries, we exited a little bit lower, but still 40% above where we were before the promotion. I think that was... Jake Bartlett: That was the question. And whether you expect to doing a similar promotion to 1 million... Ricardo Cardenas: Sorry. I don't know if we may do another 1 million free deliveries. I don't know, but we do have marketing funds that Uber gives us based on our volume. And so we're going to utilize those somehow. Whether it's 1 million free deliveries or doing something different, we will utilize those funds. Jake Bartlett: Got it. In terms of the Never Ending Pasta Bowl promotion, I think time is similar to last year. I'm wondering, you made a comment about consumers really grabbing -- taking towards on price certainty, some momentum in August. I'm wondering whether you can comment on how you expect Never Ending Pasta Bowl to perform this year versus last and maybe how it is performing, whether it's particularly resonating with consumers right now. Ricardo Cardenas: Yes. I will say that Never Ending Pasta Bowl is off to a good start for us. It's really at the center of Olive Garden's core equity of Never Ending Craveable abundant Italian food. And preference is up versus last year, and the team is doing an amazing job ensuring that guests get refilled. So the refill rate is way up. So I think guests are understanding that promotion more and more as we brought it back and they really understand the value that it brings. And I will say that the performance to date is in our guidance. Operator: Next question is coming from Peter Saleh from BTIG. Peter Saleh: Great. Maybe just one question, on the beef situation. Can you elaborate a little bit more on maybe what's driving it higher in the near term or more recently? And why do you think this is not sustainable? And then just more specifically, if these prices are sustained or maybe even go higher, would you take a little bit more price at LongHorn in the back end of the year? Just trying to understand the strategy there if beef prices actually go a little higher from here. Rajesh Vennam: Yes, Peter, let's just start with the dynamics, right? Right now, supply is constrained from a few things. One, there have been some pack or cutbacks and also Mexican cattle imports have been halted because of the screwworm outbreak. So those are kind of the drivers of the supply constraint. In addition to that, tariffs on Brazil are causing a significant reduction in beef imports into the U.S. So that's also creating a constraint. So those are on the supply side. The part of the reason we don't believe that kind of price increase, especially double-digit price increase you saw, we're seeing are not sustainable, is because the consumer can't afford these. And over time, there will be some -- there should be some demand destruction. And also, the amount of cattle on feed has actually been fairly consistent month to month. And at some point, this cattle has to be -- has to go to -- put to work, I guess. So those are the reasons how we think about where the prices might go. Who knows exactly? We don't know. We're just -- but we're a lot more open for those reasons. Now as we think about what would we do, yes, if these price -- if prices stay very high, that means that the demand is also very high, which means we should be able to take some price. We're not -- that's not our preferred path, but if the dynamics lead to a place where we feel good about demand, then yes, we'll take some price. Operator: Next question is coming from John Ivankoe from JPMorgan. John Ivankoe: I want to go a couple of different directions. First, Raj, in your prepared remarks, you did talk about seeing some demand destruction at retail. I wondered if you're actually seeing that, if it's recent. Some of the data that I've seen, I thought it was recent, was actually showing quite high demand at the retail level. So I just -- hopefully, got your facts being better than mine, just to kind of correct me what we're seeing in retail and if we are seeing any material signs in any slowdown in retail because that could certainly help us on the restaurant side from a supply perspective. Rajesh Vennam: Yes, John. So you're right in the fact that if you go back a few months, it's been pretty robust. But if you look at the last month of data, you're starting to see that decline. Actually, the data we have shows that the volume actually declined in the low single digits year-over-year at retail. That wasn't the case for prior, call it, 4, 5 months or so. So there was -- yes, there was some resiliency in that, but it's starting to -- at least we saw 1 month of data where it slipped into low single-digit decline year-over-year. John Ivankoe: And that's maybe just classic growing season being over and people are just shifting to other things. That's helpful. So... Rajesh Vennam: No, John, it's year-over-year. Sorry, I just want to clarify, we look at year-over-year. So seasonality is captured in the year-over-year. John Ivankoe: Yes. But it's -- we're speaking the same language, I just said that awkwardly. So it was interesting, hearing things like reduced portion prices of some -- reduced prices and some portions of some core menu items, things like Hawaiian Steak. I'm not going to name the brand that it reminds me of 20 years ago, but -- and this wasn't a Darden concept, but I've seen this done actually quite unsuccessfully over time. In other words, when consumers kind of expect to see a certain amount of food on the plate, especially at dinner, that's not something that you're necessarily happy with even if they are paying lower prices. So Rick, I'm sure you know exactly what I'm talking about. But was there anything to learn about previous history lessons in casual dining specifically? I think this was probably tried around 2007, 2008 where smaller portions at smaller prices were tried, but weren't successful. And things like Hawaiian Steak way back when, which are tried that a few people like, but it's really a lot of people different. Where are we on that stage gate process today in 2025, maybe versus some of the lack of success, the overall industry had 20 years ago? Ricardo Cardenas: John, I'll start with the Hawaiian Steak. It's not a smaller portion size. It's a Cheddar's. It's a great portion for Hawaiian Steak. And by the way, LongHorn ran Hawaiian Steak and did really well with it a few years back. So maybe there's different tastes now than they were back then. And in regards to portion size, I think if you go back 20, 30 years ago, overall portions were maybe a little bit smaller in the dinner menu already. And so if somebody brought even smaller portion, it went a little bit too far. And then -- but the way we're thinking about it is there is a consumer group out there that believes in abundance, but abundance is different for everybody. And by bringing some smaller portion sizes to the dinner menu at Olive Garden, there are still abundant portion sizes, but it also adds price breadth to the menu. So consumers can choose. We're not changing our entire menu to make it a smaller portion. We are putting items on there that are smaller with a compelling price point. And at Olive Garden, you still get the unlimited soup or salad and you get all the Breadsticks you want. So it's still a great -- it's still abundant. John Ivankoe: And maybe our consumers finally evolved that you don't need to have uneaten food on the plate to feel that you've gotten good value. You can just see just the right amount of portion and be happy with it. So that would certainly be a change versus the old America, but that would obviously be a good direction to go. Operator: Next question is coming from Lauren Silberman from Deutsche Bank. Lauren Silberman: So, I just want to go back to top line. A lot of questions, obviously, what's going on in the restaurant industry broadly. You talked about strong August. Can you just help unpack sort of what you saw in terms of cadence of comps during the quarter? Any more color on September from that? And then any differences in performance that you're seeing across the regions? Rajesh Vennam: Yes, Lauren, I think from a cadence of comps, actually, the gap to the industry was the biggest for us in August. In fact, when we look at our own internal comps, we were actually -- July was our weakest. And so for us, June was pretty strong. July was still strong, all positive, but just if you look at the weak month-to-month, July was weaker than June and August. And actually, like I said, August had the biggest gap to the industry. As far as regionality, there isn't a huge amount of regionality. It's actually what we're seeing is fairly similar to what we see -- what you kind of see in Black Box with certain markets still not performing as well, such as Texas, and Florida is starting to pick back up so it feels like Florida is getting better. And then depending on the brand, California had some decent strength. So that's all I can share regionally. There's not a lot of other stuff to get into there. Lauren Silberman: And then just a follow-up on the commodity side. What are you expecting in terms of cadence to get to the 3% to 4% for the year? I understand like there's a commodity price dynamic, but do you expect like 2Q to peak in terms of actual commodity inflation? Rajesh Vennam: At this point, yes, we think Q2 will probably the peak. But Q3, Q4, probably not that much lower. I mean by the time we get to Q4, we expect it to be a little bit better than where we would be. But Q1 would be the lowest that we just had, right? It was 1.5%. I think pretty much every quarter going forward is, we're expecting to be north of 3%, and that's how you get to the 3% to 4% guide. But Q2 is probably the peak. Operator: Next question is coming from Danilo Gargiulo from Bernstein. Danilo Gargiulo: Maybe a year ago or so, you started talking about the relevance and importance of improving the speed of service and maybe, arguably, with the increased focus on affordability or right portion for the right price, there could be even more of an overlap between consumers who might be choosing casual dining over fast food. And so I'm wondering if you have any early signs or any KPIs that are showing some momentum that you're picking up in the improvement in speed of service so far. Ricardo Cardenas: Yes, Danilo, across our brands, we're seeing some brands with some improvement and other brands that haven't really made a whole lot. And so we had a refocus on that this year at our general manager conference, and we would expect to see greater improvement in speed of service in the upcoming years. Recall, when I mentioned that, I said this is going to take a while. And it is taking a while. But the managers are really getting on board with it over the last year, and the reinforcement of our conference gives me great confidence that we're going to get better. In regards to, do we have any data to say that we're taking share from other categories, the only thing I can say is all of our consumer groups and all of our income groups were positive year-over-year in casual dining, which is probably the best chance to take share from other categories. And those other categories have had a little bit more traffic decline. So maybe we're taking share or maybe they're just losing some share. Danilo Gargiulo: And then it sounds from Raj's response that there's not a lot of regional differences maybe with the exception of Texas and maybe pockets in California. So if you're stepping back and analyzing the delta between the top-performing stores within the same brand and the bottom-performing stores within the same brand, what is the one characteristic that is driving the increased performance? And how can you make that more standardized across the rest of the group? Ricardo Cardenas: I will say this is a tried and true thing in restaurants, the thing that drives the most performance within a brand is the quality and consistency of the managers in that restaurant, and the team. And so as turnover gets better, if you've got a great general manager and a great team of managers that are running things to our standards, you have better performance. And so that's going to be restaurants for the rest of our lives. You can have restaurants that are in a market that's doing great, but the restaurant is not doing great. It all comes down to leadership. Operator: Our next question today is coming from Dennis Geiger from UBS. Dennis Geiger: Just wanted to ask if anything to note -- else to note on sort of behaviors that Olive Garden, LongHorn or broadly across the portfolio as it relates to performance across daypart or even kind of within the menu side, desserts, alcohol, anything to call out there? Rajesh Vennam: Yes. Look, I think we are seeing -- I mentioned a little bit about alcohol. There is less -- we're seeing some lower preference on alcohol across most of our brands. There is -- some brands at LongHorn, for example, has grown lunch more than their dinner, but all dayparts are growing there. And then in Fine Dining, I think we're seeing a little bit more drop-off in the business travel that's leading to some weekday weakness. But those are some of the dynamics from a consumer perspective that I can share. Operator: Next question is coming from Chris O'Cull from Stifel. Christopher O'Cull: Rick, the conversation around eliminating the tip wage seems to be ramping up. Do you believe there's a risk that it could be eliminated? And how are you thinking about any potential impact it could have on the business? Ricardo Cardenas: I would start by saying this industry has really diverse business models. And we believe that the policy environment should reflect the level of diversity in the model. As a full-service operator, our business model continues to be the best choice for our guests and our team members. And I will tell you that whatever happens, we're going to be okay with it, okay in the way we react. So I don't foresee a big change in that. But if it does, we will work through those things and come out okay. Operator: Next question is coming from Brian Vaccaro from Raymond James. Brian Vaccaro: Just two quick ones, if I could. First on the housekeeping side. Raj, could you break out the Olive Garden comps between traffic and check? And as we think about check at Olive Garden, I think it's been exceeding pricing for the last several quarters. Is it still reasonable to expect check to exceed price as you think about the next few quarters? Rajesh Vennam: Yes, Brian. Let me start with the breakdown. Olive Garden same-restaurant sales was 5.9%. Their traffic, as we measure was 2.8%, but then they also had catering of 80 basis points. So I would categorize that as 3.6% traffic growth. And then when you think about the check, the pricing was 1.9%, and Uber fees, basically the delivery service fee net of the discount, was about 40 basis points. So yes, as we go into the future, do we expect check to be a little bit higher than pricing? Yes, but it will be because of the delivery fee and service fee. That's really the driver. Yes. Brian Vaccaro: And then just as a follow-up, obviously, talking about investing in the guest experience, as you've been doing for a while, but thinking about fiscal '26 specifically as well. When you look at labor in the first quarter, it looks like labor per operating week as we look at it, was up 4.5%, maybe closer to 5%. You talked about the higher incentive comp, and obviously you have higher traffic, which takes more labor to service. But I'm curious to what degree that also reflects some reinvestments that you're making in the guest experience. And maybe you could provide a few examples of the specifics on those reinvestments. Rajesh Vennam: So Brian, let me just start by saying, from a labor perspective, our total inflation was 3.1%, right? So if you look at -- you mentioned 4.5% increase on dollars, but if you take the 3.1%, that is part of it. Then it was up about 1 point or so, but our traffic was up closer to 3% once you take into consideration the catering for -- at the Darden level. So that means we're actually getting some leverage on that traffic. And so that's really what's happening. And that's why I mentioned in the script that we were -- we had productivity improve actually year-over-year. We continue to look at ways to invest in labor. I don't think we need to get into specifics, but some of the things that Rick mentioned about speed, those are places where we're looking at. How do we help ensure that? But that doesn't translate necessarily into a labor deleverage because you actually get more throughput when we make those investments. Operator: Next question today is coming from Andrew Charles from TD Cowen. Our next question is coming from Jim Sanderson from Northcoast Research. James Sanderson: Just had a few follow-up questions. Going back to the delivery segment, have you discussed what percentage of sales mix was incremental? I think that's been a little bit of a moving target, especially given the promotions. Maybe you could update us on what you expect incrementally out of delivery for both Olive Garden and Cheddar's. Ricardo Cardenas: Yes, Jim, I'll speak specifically outside of the promotion. It's about 50% incremental. During the promotion, when you get free delivery, some of the people that would have gotten normal to go probably shifted into delivery. But outside of that, it's about 50%, both at Cheddar's and Olive Garden. James Sanderson: So relatively stable with what it has been, let's say? Ricardo Cardenas: Yes. James Sanderson: And just a follow-up question on Olive Garden, when you were talking about the breakdown of same-store sales. I didn't really detect any negative mix. And I was wondering, does that mean that the smaller portions and the promotions aren't having any meaningful impact on check? Is that the right way to look at that? Rajesh Vennam: Well, they have -- that specifically has a negative impact, but it was offset by other mix. So we are seeing -- we had -- I think we mentioned on the call, we had the Calabrian Steak and Shrimp that had a higher price, but we actually had -- saw a pretty strong preference there, that helped. So it was mostly entree mix itself tended towards higher value, sometimes maybe higher price items. Operator: Next question is coming from Andrew Charles from TD Cowen. Zachary Ogden: Yes. This is Zach Ogden on for Andrew. Could you just elaborate on where the strength is coming from for Other Businesses? Are there certain brands that are outperforming others and what would be leading to that? Ricardo Cardenas: Do you mean in the Other Business or other business? I just want to make sure I understand the question. Zachary Ogden: Yes. So the Other Businesses segment, so the 3.3% in 1Q. What was the strength coming from there? Ricardo Cardenas: Well, we mentioned that 3 of those brands were all positive, some more positive than others. I think Cheddar's was the most positive and then Yard House after that and potentially Seasons are right around there. But I think Cheddar's had the highest comp in that segment. Zachary Ogden: And then could you just comment on what you're seeing from the younger cohort more broadly, maybe just beyond delivery? Are you seeing certain -- or, I guess, relative strength or weakness among Gen Z? Ricardo Cardenas: They're fairly similar to the rest of our consumer group. Operator: Thank you. We reached end of our question-and-answer session. I'd like to turn the floor back over for any further or closing comments. Courtney Aquilla: This concludes our call. I want to remind you that we plan to release second quarter results on Thursday, December 18, before the market opens, with a conference call to follow. Thank you for participating. Operator: Thank you. That does conclude today's teleconference and webcast. You may disconnect your line at this time, and have a wonderful day. We thank you for your participation today.
Adam Castleton: Good morning. Thank you for joining LSL's Interim Results Presentation. I'm Adam Castleton, LSL's Group CEO, and I'm here with David Wolffe, Interim Group CFO. I'll first cover highlights, market context and progress we've made in our divisions. David will then take you through a financial review. I'll then talk about outlook and some key takeaways, and we'll take questions at the end. We're recording this event and a replay will be available on the LSL IR website. These are my maiden set of results as Group CEO. I'm really pleased to report the results are in line with expectations, and we continue to make good operational progress. Revenue and profit are up with operating margin maintained at a 15-year high. Return on capital employed of 31% for the last 12 months is much higher than historical levels. These reflect the improvements we've achieved following the transformation of the group in recent years, and this was achieved while continuing to invest for growth. This performance underlines that our capital-light resilient model is delivering consistently while we are reinvesting for the future and the full year outlook remains unchanged. Moving to key financial highlights. Group revenue increased by 5% to GBP 89.7 million, and we maintained our strong market share. Group underlying operating profit was up 3% to GBP 14.8 million, while we continue to invest strategically in our business and absorb the national insurance increase. We are a highly cash-generative business. Our cash conversion for the last 12 months was 95%. This is at the upper end of our target range of 75% to 100%. We performed well in a recovering market. Total mortgage lending in the market increased by 5% with a very different picture in new lending, which was up 22%, whilst product transfers rebalanced back 10% year-on-year. We gained market share with our new mortgage lending up 23%. U.K. residential sales were up 17% with a pull forward of demand given the stamp duty changes. We maintained our market share of this market. Mortgage approvals increased 10%, with the change in our lender mix slightly reducing our estimated share in surveying and valuations with revenue up 9%. We operate 3 divisions with leading market positions, each benefit from strong long-standing client relationships with scale and strength in their markets as well as expertise and deep domain knowledge. Each delivered operational progress during the period. In Surveying & Valuation, productivity per surveyor increased by 8%. B2C revenue increased by 43%, and we renewed a top 5 lender contract and started working with another new lender. In Financial Services, new mortgage lending was up 23%. Revenue per adviser increased by 8% and the implementation of the new CRM is progressing well. In our Estate Agency Franchising division, we increased the size of our lettings portfolio, making 3 acquisitions during the period with a strong pipeline, and we added 3 new branches to our franchise network. In summary, each division continues to execute well while maintaining discipline on margins and returns. I'll now hand over to David to take you through the financial review in more detail. David Wolffe: Thank you, Adam. Good morning. I'm David Wolffe, Interim CFO at LSL, previously CFO at a number of high-growth, tech-driven and listed businesses. Let's look at the group's financial performance in more detail. In the half year, revenue grew 5% to GBP 89.7 million, driven by 9% growth in our largest division, Surveying & Valuation. Underlying operating profit increased to GBP 14.8 million, up 3% year-on-year, and I'll come back to that increase in just a moment. Operating margin remained strong at 17% at the upper end of our historical range. Cash from operations at GBP 7.4 million reflects shareholder distributions, planned investment and some working capital timing. Again, more on that shortly. Return on capital employed for the last 12 months increased to 31%, very strong compared to historical levels. So the first half has delivered continuing growth while maintaining a high return on capital profile. Coming back to that operating profit increase, there are 2 main points to highlight. First, we have made positive operating performance progress with an underlying increase of GBP 3 million before strategic and investment decisions. This progress is driven by our volume growth across the business, improved pricing and the first positive contribution from the Pivotal Joint Venture. Second, we made strategic decisions in 2 areas, which reduced profit in the period. We stepped away from some protection-only business as we rebalanced our adviser firms towards mortgage and protection or composite firms, and we made investment across Financial Services and Surveying to drive future growth. So the headline growth of 3% is a combination of that underlying progress and the growth investment. Turning now to cash flow and capital allocation. In the half, we delivered positive operating cash flow of GBP 7.4 million after working capital movements around the 2024 year-end. I'll come back to this in just a moment. We deployed capital in 2 key areas in the period. First, in shareholder returns, we distributed GBP 9 million in dividends and share buybacks. The interim dividend is maintained at 4.0p, and the buyback program continues with GBP 3 million deployed to date. Second, in strategic investment, GBP 3.6 million of cash was spent across CRM development, data and lettings books acquisitions to drive future growth. Our balance sheet remains robust. With June cash at GBP 22 million and a GBP 60 million unutilized facility, we have strong liquidity and our capital-light model ensures ongoing flexibility. Looking at the positive operating cash flow and working capital in a bit more detail now. The line at the bottom of this slide shows our adjusted cash from operations performance over the last few half periods. The GBP 7.4 million we reported in H1 presents as a lower number than last year, but we had a timing effect of GBP 4 million excess working capital inflow just before the 2024 year-end that then unwound into an outflow into 2025. You can see this in the lines above. In operating profit, we have stable progression. Depreciation is flat and low, reflecting our capital-light operating model. Cash on lease liabilities continues to moderate after the transformation of the Estate Agency business. But on working capital, H2 2024 inflow of GBP 5.9 million you'll see in the box was an outlier, which illustrates these timing effects around the year-end. The unwind in H1 of 2025 makes our cash conversion look suppressed in the half, even though on a rolling 12 months basis, we made really good progress. We expect that the second half and full year 2025 cash conversion should be normalizing towards our target of 75% to 100%. Taking each division in turn, let's run through the story of the half. In Surveying & Valuation, revenue grew 9% to GBP 53.2 million, within which B2C was up 43%. Underlying operating profit was GBP 11.9 million, with margins at 22%. This is down on the elevated levels of H1 last year with Surveyor commissions now normalized, and this effect is in line with what we have flagged before. But in sequential performance compared to the second half of 2024, we have made good margin progress, up 200 basis points. Volumes grew with jobs up 7%. Fee per job was up 2% with better terms and more B2C activity, and we improved Surveyor productivity in jobs per surveyor, which was up 8%. In Financial Services, revenue was flat overall, but this illustrates the combination of mortgage-related revenue up 21% and protection revenue down 12%, following our strategic repositioning away from protection-only brokers. As a result, adviser numbers were down to 2,637, but adviser productivity increased 8% in completions per adviser, and we grew fee per completion by 3%. But overall, at a divisional level, despite the broker repositioning and some P&L investment in CRM, operating profit grew 23% to GBP 4.8 million, with Pivotal making that positive contribution. In Estate Agency Franchising, revenue overall grew 1%, but while residential sales revenue was up 24% and lettings revenue up 4%, our land and new homes business was pushed back by a contract change. As a result, underlying operating profit margin remained flat at 24%. We are expecting improvement in the second half with cost savings feeding through. Branches grew by 1% after 3 more openings in the half, with overall sales income per branch up 22%. The lettings portfolio now stands at over 37,400 properties after 7 lettings books acquisitions since mid-2024, with overall income per property now up 1%. So with progress in each of the divisions, the group delivered on expectations in the first half, whilst at the same time, positioning itself for stronger growth in the second half of the year. And with that, I'll hand you back to Adam to take you through the outlook. Adam Castleton: Thank you, David. Expectations for the full year remain unchanged. In the second half, we expect a sequential step-up in profit in each division with an increase in refinancing activity, a strong activity in 2-year and 5-year mortgages in 2020 and 2023 mature in large numbers. We've already seen this in July and August, with July the strongest refinancing month for us this year. We also came into the half with residential sales pipelines increased from this time last year. We will continue to invest in our business in the second half, for example, in lettings books and the FS CRM system. Indeed, in September, we've already completed a further 3 lettings books. When I presented our preliminary results back in April, just before I started out as Group CEO, I set out my early thoughts and priorities. These remain unchanged, and I'm pleased with early progress. Our senior leadership teams are responding well and are raising their sights and ambitions even higher for the future. We continue our investments in technology and data, notably the new CRM in FS and data in Surveying & Valuations, whilst we are also trialing new AI-enabled solutions to improve productivity. I'm already working closely with our divisional business leaders on the opportunity to leverage group strengths, and I'm encouraged by the early signs that I'm seeing. I'm working very hard and even more transparent and clear communication, both internally and to the market. For example, we've just rolled out the first wave of updates to our IR website, adding some fresh new elements to allow greater accessibility and transparency. This is all steady, deliberate progress, and I look forward to sharing news of our ongoing progress. We are a diversified, resilient cash-generative group, strategically positioned for growth. We're delivering, performing in line with expectations, and we're investing carefully while maintaining shareholder distributions. We're building consistently. The LSL of today is stronger and leaner, delivering higher-quality earnings. It is early days in my tenure as CEO, and I'm excited about the growth opportunities open to us as a group. With 2025 on track, we're looking ahead with renewed ambition and with confidence about our future. With that, operator, can we please move to Q&A. Operator: Thank you. [Operator Instructions] There appears to be no questions at this time. So I'd like to hand the call back over for questions via the webcast. Unknown Executive: Okay. Thank you. We've got a number of questions on the webcast. I'll ask them one at a time. The first question is from Glynis at Jefferies. Glynis asks about the Surveying division and the year-on-year movement in the operating margin. You talked about this as -- in the second half of 2024, you're talking about it again today. How should people think about the first half 2025 margin? And what sort of level is considered normal? Adam Castleton: Yes. Thank you, Glynis. Thank you for your question. So last year, as we flagged at the interims and the prelims, we had enhanced margins in the first half of last year as we came into the year in 2024. We had a burst of activity, and we didn't bring back the surveyor incentives immediately. And secondly, there were some administrative heads that we didn't bring back immediately as well. Therefore, there was quite an enhanced margin for the first half of, I think it was 25%, sequentially then that fell in H2 and has now recovered to about 21%, 22%. We expect that really to be the norm. So at the moment, 21%, 22% is really the norm for our margin going forward, the 25% was elevated in the very top end of what we might normally expect to see. Unknown Executive: Great. Thank you, Adam. The second question comes from Jonathan, who's at Edison. Jonathan asks about the impact of changes in stamp duty. Have you seen any material changes in demand in the month since the stamp duty changes came into effect? Adam Castleton: Yes. Thank you. Thank you for your question. Yes, there was a spike, particularly in March with the stamp duty changes. So we saw for the whole half, 17% up for the overall market, which we tracked. March was particularly strong. It was actually 170,000 transactions in the market for that month. What we've seen since then is a good market as we expected. In fact, because H1 2024 was a bit softer, the 17% looks very high. But in fact, the second half of this year will be a little bit more in transactions than it was in the first half. So we see sequential rises, notwithstanding the spike. So certainly, if the question is which -- from time to time, people have asked whether somehow there was a spike and then it sort of hollowed everything out, it certainly didn't. We entered this half year with increased pipelines, which is great. As I said, we expect residential sales to be a little bit more in the second half than it was in the first half, notwithstanding the spike duty spike. Unknown Executive: Great. Thanks, Adam. We have a follow-up question or a second question rather, sorry, from Glynis at Jefferies. There's been a lot of talk in recent weeks about potential government policy changes. How has this impacted your business in recent weeks? And if some of the changes that are being speculated in the press were put into place, what are the implications for the group? Adam Castleton: Thank you again, Glynis, for the question. Obviously, something that we're all reading in the newspapers. The autumn budget is obviously a couple of months away in November, and we read, as you do, Glynis, all the various either ideas or kites that are being flown, it's hard to tell which they are. I don't think I'll comment on speculating what may not come through and what that might mean. Obviously, as a business, we stay very close to what will happen, what we focus on are the facts that we have at hand and as a business that covers the whole range of services in the property and lending markets, we've got really deep knowledge and deep data. So if we look at all the information that we have across Surveying Financial Services and Estate Agency covering mortgage applications, completions, fall-throughs, which are when agreed sales fall through sometimes because the chain has fallen through because people pull out. We're seeing nothing of any of our metrics and -- because I expected some of these questions rather than checking these numbers once a day, I'm checking them twice a day with people and ringing people up. We're not seeing anything at the moment. Whether there's a question of sentiment, I can't say, but certainly, all of our metrics are showing no change of customer behavior. And I think depending on what does or doesn't transpire in the budget, as we've demonstrated over many, many years, we're a dynamic business. We're very quick to react and to change the market. We're well positioned for that. And for any negative shocks that comes to the market in the future, of course, following our franchising restructure, we're a lot more even in our earnings, less volatile. And so we're certainly less spiky. And we're very, very quick to react. And as I said, the data that we have is very, very specific. Just as a little example, when our friends across the water introduced the tariffs, I made a call and said, could they pull out fall-through data from Solihull, which is where the Land Rover factory is and in the Northeast where the Toyota factory is just in case people felt nervous because of the tariffs. So we really stay on top of data closely. And whilst I can't tell what may happen tomorrow or the day after in the budget, certainly, everything we've seen demonstrating that the customer behavior is unchanged and in line with what our expectations are. Unknown Executive: Great. We're actually going to move back to the conference call. We've had a question on the conference call, and then I've got another 2 questions on the web platform. Operator: And we take a question from Robert Sanders from Shore Capital. Robert Sanders: Just I suppose following on from that question about the government and sort of the other aspect of the market that's been a bit open to surveys has been the lettings market and [indiscernible] whatever saying that there's a downturn. Is that something that you're experiencing? And what do you think the outlook is going to be for the lettings market given renters rights [indiscernible] as we move into the next year? And then as a follow-on question, can I also ask you about what your -- you talked about the technology and data innovation and what you're seeing as the opportunities, particularly in the Surveying & Valuation division for the use of AI? Adam Castleton: Certainly, yes. Thank you. Thanks very much. Good question about the lettings market. The first thing I'll say is the lettings market is extremely resilient. If you actually look at the number of privately rented dwellings in the country, it's been very stable at GBP 5.4 million, GBP 5.5 million for the last few years, so we've seen no change of that. From our perspective, we have slightly increased our lettings portfolio, as David said, to over 37,000. And actually, as legislation, you mentioned the renters rights becomes a bit tighter. What we're seeing is that there's more interest from landlords who are self-managing to move towards a managed service. And we're starting to see that movement and that interest and we're certainly marketing to those landlords. It's interesting, you mentioned some of the metrics and the headlines that we see that forecast problems for the lettings market. I would just say that if you note some of those metrics, they don't necessarily show what they may appear to on the face of it. The first thing is there's been some publicity about lettings instructions being down, which is actually something we've seen over a number of years. One of the main reasons for that is that people are staying in their properties for longer, and therefore, there are less instructions than historically they were. Landlords will keep a good paying regular tenant and tenants will -- with everything going on in the market, will prefer to stay where they are. So that's certainly the reason -- one of the main reasons that instructions are down. It's not demonstrating that things are leaving the market. And also, we hear metrics quoted around there being more properties for sale that were previously rented. And whilst that might be the case, of course, those rental properties are often bought by other buy-to-let landlords. So certainly, we don't see a big change in the numbers of properties rented. We see opportunities for further growth. As David said, since the middle of '24, we've done to the end of the period 7. And actually, we did 3 lettings books during the half. And since the end of the half, actually in September, we've done 3 and just about to close to 4. So we see some good opportunities there. It's certainly not buoyant as it was when originally buy-to-let really grew quite strongly, but we're seeing no material change in the numbers of properties, dwellings that are privately let. In terms of the renters rights, as you mentioned, and as I say, just to reiterate, a, we don't see that changing materially the structure of the market. As I said, it may certainly lead to an opportunity for us to bring landlords who are currently self-managing over to a managed service. And that's probably a general point to make around regulation and regulatory changes. As a larger player, we're well placed to make the investments required to cover any changes necessary. And obviously, our deep relationships with whether it be our franchisees or our financial services, we're able to give our sort of trusted advices we have for many, many years. Unknown Executive: I've got 2 questions here from Robin from Zeus. Again, I'll ask them one at a time. In terms of the first question, could you please provide some more detail on Pivotal Growth in terms of current run rate of advisers, revenue, trading performance? Adam Castleton: Yes, Pivotals -- the Pivotal investments is scaling very well in terms of EBITDA, which is the actual entity results in the first half, that was -- again, these are within the interims, these are about GBP 3 million, GBP 4 million of EBITDA. So on a decent run rate for the year. So it's scaling up well. There were 2 small acquisitions during the half that we announced in the interims. And actually, in the post balance sheet note, you'll see that there was one further acquisition that completed after the end of the period. So scaling up nicely with over 500 advisers, the EBITDA run rate is going well. We're looking forward to continued growth and eventual realization of our investments. Certainly, we expect that to be well over our return on our weighted average cost of capital. Unknown Executive: Great. Thanks, Adam. And then there's a second question from Robin also about Pivotal growth. So Robin's question is, can you please expand on your reference about LSL being founded 21 years ago and it's being built on -- success being built on operational resilience, opportunistic dealmaking and entrepreneurial culture. What are LSL's strengths? And how does Pivotal fit into these strengths? Adam Castleton: Okay. That's okay, interesting. So yes, I mean, I won't repeat the words, but the business has -- it's quite entrepreneurial. It's very agile and it's very dynamic. We're very quick to move and to take opportunities. One of the examples actually I often use is when the pandemic hit at the same time that we were planning for the worst case for a year where we would have no business, we were also planning for the state agency to open immediately, and we're planning for both. And in the end, we really, really farmed the market well as it recovers. So very, very quick, and we're always agile. The opportunity -- the opportunistic element of Pivotal when it was founded was for a buy and build within the broking business, which exists in many other industries as we know, and there's an opportunity for us in the broking business, which we have launched. So really, it is an opportunistic approach to buy and build within a sector that had not seen it before. And so far, we're pleased with the scaling. And as I said, we expect a realization of our investments in due course. Unknown Executive: Great. That's all the questions covered on the web platform. No further questions. That's it. Back to you, Adam, for closing remarks. Adam Castleton: Listen, thank you for all the questions. I apologize for my colleague, David. They've all been pointed at me and I've answered them all. So I'm sorry that your -- all your numbers are not... David Wolffe: [indiscernible] Adam Castleton: Thank you very much. So listen, thank you for the questions. We're really excited about the opportunities ahead for the group. We're available for any follow-up that you may need. And I thank you all for your questions, your interest, and I look forward to carrying on the dialogue with you. Thank you.
Operator: Welcome, everyone, to the half year -- Welcome, and thank you for joining Exor's Half Year 2025 Results Conference Call. Please note that the presentation materials and the related press release are available for download on Exor's website, www.exor.com under the Investor and Media Financial Results section and any forward-looking statements made during this call are covered by the safe harbor statement included in the presentation material. [Operator Instructions] Please note that this conference is being recorded. At this time, I would like to turn the conference to Exor's Chief Financial Officer, Guido de Boer. Sir, you may now begin. Guido de Boer: Fantastic. Thank you for this introduction, and happy to have this half year results call. And as you'll see in the new format of our half year report. I hope that gave good insights, and I want to take you through the highlights in this presentation. So our NAV per share outperformed the MSCI World Index by about 5%, largely aided by the EUR 1 billion buyback. Companies did well, but a mixed bag of performance across the different companies, which we'll address a bit later. We're particularly pleased with the performance of Lingotto performing with an 11% increase, mainly from the public investment part in the backdrop of the declining market. And this half year saw us monetizing EUR 3 billion of Ferrari stake as well as some other items leaving us with good firepower to monetize, to invest in the future. And it leaves us with a very healthy debt ratio at 5.5% of our GAV. So moving to the key figures at the half year. Our gross asset value went down by EUR 2.5 billion, partly from value changes, partly from the buyback and our NAV moved in line with that, while our NAV per share saw an increase and our loan-to-value, as mentioned, is more or less half than what it was at the end of 2024. So our NAV per share growth went up by 0.9%, and 3.2% of that growth is attributed to our buyback, given that we buy back our own shares at a discount the positive impact on NAV compared to the number of shares that we reduce is delivering this growth. So even ex buyback, our portfolio has done better than the MSCI World index. And this is an important measure because we want to outperform relative to the index. We also want to show absolute returns. And in that sense, obviously, we're disappointed that our TSR, even though better than the market is negative, and we aim to improve that in the coming period. So if we move to the overview, I first would like to present to you a new classification. And rest assured, I don't want to make a habit of this so that you need to change your models all the time. This was actually intended to provide you further insight and probably also ease for building your models. Given that Exor Ventures is now managed by an external investor. We moved that to the other funds moved by third parties into others. And you really see separately the performance of Lingotto, which are the funds operating under our own management. And we thought it's useful not to group cash and cash equivalents under others but show separately also, if you want to look at a net debt basis to facilitate your analysis. So hope it's helpful. And if you have any comments or suggestions or requests for historical data, please feel free to reach out to the Investor Relations team. So if we then move to the drivers of change in gross asset value in this new format and maybe starting on the right-hand side, you see the change that I mentioned previously of a GAV of EUR 42.5 billion to EUR 40 billion, which split in EUR 1.1 billion of shareholder distributions, around EUR 100 million of dividends and EUR 1 billion of buybacks. So it's a decrease of GAV, but not necessarily reflective of performance, adjusted capital distribution. And you see EUR 1.4 billion decrease in value, which is the real metric of our performance on GAV. If we then move one column to the left, cash and cash equivalents. Here, you can see well the movement in our cash flow, where we've invested EUR 1 billion in new investments. We realized EUR 3.5 billion of disposals and obviously, the EUR 1.1 billion in distributions. So if we take the EUR 1 billion in investments, you'll see and we'll go into more detail later. EUR 4378 million went into listed companies, principally Philips and a minor part in Juventus and then a bit in commitments on Lingotto and EUR 428 million in others, which we invested in bioMérieux. The disposals line for EUR 3.5 billion breaks up quite simply in EUR 3 billion for Ferrari and almost EUR 0.5 million of proceeds from the reinsurance fee costs that we invested in as part of the sale of PartnerRe. Now we have the line change in value, which I propose we address in a bit more detail in the following slides. So performance of listed companies. I mentioned already the investments behind Philips, Juventus and the disposal of Ferrari. If you then look in the change in value, you basically see that the change in value of Ferrari is marginal, where it started on the first of January and where it landed on the 30th of June. We were quite lucky in our timing that we did the trade at the all-time high in that period, but a very flat movement in between start and the end of the period. CNH, a similar story, and we measure our returns in euros and in euros, it was flat, notwithstanding a strong movement between the dollar and the euro. The big driver of the decrease in value was the disappointing share price movement of Stellantis as well as that of Philips, which started the year a bit above EUR 24 was at the half year at EUR 20 and now ranges around EUR 24 again. So the good thing is the EUR 700 million of loss has rebounded in the year-to-date, large. And then obviously, the positive news in the half year was also the strategic transaction on Iveco which in the run-up to that transaction led to a significant increase in the share price. And that is a monetization for Exor at a very attractive price, as well as a good home for Iveco for the future is that the pending transaction will complete in 2026. So those are the key moves in listed companies. If we then move to unlisted companies. We had some smaller investments between -- behind Via Transportation where there was some shares available ahead of the IPO. And I'm happy to say that following the successful IPO on NYSE last week, we'll move Via to the listed companies in the following reporting and some existing commitments we have on TagEnergy and ShangXia. And you'll see the movement in value, where the largest ones Institut Mérieux on the back of the increase in share price of bioMérieux, Via Transportation based on its strong performance. Welltec and The Economist actually largely FX movements and the other amounts are relatively smaller. So if we then move to Lingotto and others. You see we invested in private strategies around EUR 166 million. And you see a very strong performance of the public investments, notwithstanding the equity capital markets in general, declining. So we're very happy with how the Lingotto funds deliver returns, which are less correlated to the rest of the portfolio and outperforming the market. We then move to others. There, you see funds managed by third parties. So that also now includes Exor Ventures. And it was also including the reinsurance vehicles where you see the half billion of disposals. So we're quite positive. The funds are doing quite well. The minus EUR 72 million is actually EUR 427 million negative FX and both Exor Ventures as well as the reinsurance vehicles in local currency have been performing well. In listed securities, you see, again, the investment of EUR 317 million in bioMérieux and the change in value is largely due to the decline in share price of Neumora and smaller investment that we've done in the past. And I think those are the main items to highlight in Others. So Cash and Cash Equivalents, I largely mentioned this previously, we had strong dividend inflows of EUR 624 million, of which we distributed again EUR 1.1 billion to our shareholders. We raised disposals between EUR 0.5 billion, which we reinvested for EUR 1 billion, and we repaid bank debt for EUR 547 million and a bit of a bond, which leads us to a cash position now of EUR 1.5 billion, which is obviously very, very healthy. And that's in line with gross debt that, as I mentioned, with the reduction in bank debt and the bonds now stands at EUR 3.5 billion rather than the EUR 4.1 billion at year-end. And as you know of us, we try to have a very stable maturity profile. So we have no cliff payments and on the short-term obligations that we have here can easily be filled out of our cash positions. So with that brief summary, I would like to open the floor to Q&A. So over to you at the operator. Operator: [Operator Instructions]. We will now take the first question from the line of Monica Bosio from Intesa Sanpaolo. Monica Bosio: I have three. First of all, on the future investments. My perception is that maybe the group priorities are more on the health care side. Or do you see real true opportunities in the luxury segments? I'm just wondering because in the last conference, the company didn't see real opportunities in the luxury segment. And the second question is on the size of the potential acquisitions. The press speculated a lot on this. Any comment from you on this side? And do you have any time horizon for the completion of the new investments? And the very last is not only investments but mainly on disposal, should we expect in the coming future, some other disposal on top of [ Lifenet ]? Guido de Boer: Fantastic. Thank you, Monica. Good questions as usual. So in terms of priorities for us when evaluating a potential acquisition, we look at fundamentals. Does it have the right strategic fit our financial fundamentals, cultural alignment with us as an owner, what our leadership strength with us their governance proposals. And we base this on analysis of each individual company. So it can be health care. It can be luxury. These are in particular industries where we have domain knowledge within the team, but it could even be outside that, if the investment opportunity is sufficiently attractive for us. So there is no priority preference of health care over luxury. In terms of size, we basically have said that we are considering to do transactions, which are meaningful in the perspective of our total GAV and 5% is a percentage where this is -- becomes meaningful. But again, we look at every individual opportunity to decide if it's attractive or not. And on disposals, we continuously evaluate our portfolio to decide whether we should increase our stake like we've done on Philips in the period or whether it's a good time to dispose. If there's anything to update, obviously, you will be the first one to know. But for now, there's nothing further to mention. So Monica, I hope this answers your questions. Operator: We will now take the next question from the line of Martino De Ambroggi from Equita. Martino De Ambroggi: The first question is on the financial flexibility because once you divest Iveco stake, you will have another EUR 1.3 billion cash in. So would you prefer to look for one more big ticket, as you mentioned, 5% of GAV or buyback could be another priority. And specifically on the buyback, you don't need any divestiture to continue to buy back shares. You already finalized EUR 1 billion buyback in one shot, but why you are not starting additional buyback considering the high discount to net asset value. And the third question is on the -- well, sorry to be more specific on the name, but Armani is I don't know, up for sale, probably not shortly and so on. But just from a theoretical point of view, so just theoretically, could it be an interesting asset for you or you're absolutely out of the game, even if today, it's too early to talk about it? And very last on Ferrari, when you sold the stake, you mentioned there was an excessive concentration in terms of asset value. Today, Ferrari is roughly 90% of the net asset value. So the issue of too high concentration could come back. But what's your way of thinking about it for future in case the concentration further increases? Guido de Boer: Yes. Thank you, Martino, and good to have you on the call again. So on buybacks, they are part of our resource allocation process. And in a sense, the buyback, the discount is also an opportunity for Exor to reinvest capital. And for investors that want to remain on to benefit from a NAV per share increase from that, which you've seen in this half year. We've just done EUR 1 billion of capital return. So in terms of our market cap that is something that's very, very sizable. But -- as I mentioned, every time we do our portfolio review, we consider to increase or reduce the holdings in existing companies. We consider new investment opportunities that we have and we consider buybacks, and we decide on what we feel is the most attractive choice or multiple choices between those. So we'll continue to do that and consider buybacks as part of the process. Armani, don't really have anything to comment on the individual transaction as we obviously never do that. And Ferrari, the concentration has nicely reduced. It was 43% when we did the transaction, we're now at 39% of our gross asset value, which is the way we look at it. Indeed, if you look at it as our market cap, you probably meant 90% of market cap rather than net asset value. That is high, but then you could almost see Exor as buying Ferrari and getting the rest for free. So in that sense, I would see this as a great opportunity for investors to buy into the extra stock. And concentration, maybe to have that as a general point, we like concentration because our belief is that if we buy 1 share of every stock in the index, we perform like the index, and we want to outperform. So we invest in companies where we have conviction. And Ferrari is absolutely one where that holds true. So I hope this addresses the point you raised, Martino. Martino De Ambroggi: Yes. Thank you, Guido. And you are right. I mentioned as a percentage of NAV, but it was on market cap. One more follow-up on Lingotto which made a great job because the performance was very strong. Could you remind us what were the main drivers for this performance? And in terms of strategy, are you planning to open the doors or to accelerate on third parties asset? Or this is something that is not in your -- on your table? Guido de Boer: So one for us to invest more or less behind Lingotto strategies is part of the portfolio review process, as I mentioned. And if we would invest more behind existing strategies or if there's new ones, we'll obviously announce that to the market. For us, our strategy is not to grow assets under management and gain management fees. Lingotto was created to deliver performance to us. So I think that is critical. We want to grow our assets under management through performance rather than capital inflows. And as you see, we are delighted by the performance at it, showed in this half year, which it has been showing over a longer period now. So the quality of investors that we've been able to attract makes us obviously very pleased with having put the funds behind Lingotto. Martino De Ambroggi: And about the first half performance, is there any specific driver leading to such a good performance? Guido de Boer: I think they're great investors that know how to find the stock that perform well. Operator: We will now take the next question from the line of Joren Van Aken from Degroof Petercam. Joren Van Aken: A lot of great questions have already been asked. But just one from my side. I remember Mr. Elkann saying a while ago that private valuations were higher than listed assets and not long after that you bought the Philips stake. Today, I'm hearing that high-quality assets in the private market still have very high valuations. Do you think that the bid-ask spread has narrowed sufficiently on the private side? Or do you think that listed is still more attractive today? Guido de Boer: I'm not sure if I've seen too much reduction in price expectations from private assets. So I don't think that much has changed on private asset valuations and public market valuations, I think that's your day job. So you know much better than me, but also there, I would say there is a big disparity between certain type of companies like the large tech companies versus some slower-growing companies or companies that have 1 quarter earnings miss, which have then a disappointing share price performance. So I think if you look in public markets, there's definitely opportunities to be found but also private assets can have their individual situations that the valuations are attractive. So apologies for -- not trying to evade your answer with your question with a clear answer. But I think there's not a one size fits or response to your question. So Joren, I hope that's clear how we look at this. Operator: We will now take the next question from the line of Hans D'Haese from ING. Hans D'Haese: And I wanted to state first, Guido, that really happy with the new tables layout and increase even better transparency already was happy with IFRS 10 change and how this really helps also with the valuation drivers for listed companies and so, a very good job. Then regarding portfolio, we've seen that you've been very explicit in what sectors Exor would like to increase its exposure and for what, so thank you for that. In the meantime, we only saw a considerable increase of Philips. So we are waiting for other stuff. If now opportunities arise for acquiring minority stakes in other companies, companies, for instance, that you already are an important shareholder like, for instance, The Economist. Would you consider to increase the stake? Is this something that would fit in the portfolio? Or are you sticking to it should be health care literally? That's one question. And then the second one, in light of market expectations of further U.S. dollar weakness and considering that your stakes in CNH and Clarivate and Lingotto are dollar sensitive. What is your hedging strategy? Are you considering -- are you doing something? Or is this something that is not part of the strategy of Exor? And then third and last question, what are your considerations about investing in Bitcoin and cryptocurrencies? Do you see them as an alternative for your cash position? Or do you see them as a different asset class? Is this -- just do you want to share your thoughts about this? Guido de Boer: Yes. With pleasure. Thanks, Hans. First, for the compliments, much appreciated because we've been working hard on providing information to you and all our other stakeholders, which is as clear as possible so that we can talk more about fundamental activities like you now asked about. So much appreciated. On portfolio, whether we would consider investing in existing companies versus like, for example, The Economist or in only health care technology and luxury. We are, in a sense, agnostic. Why have we said health care, technology and luxury? Because these are sectors where we think there are structural tailwinds and where we've built up a domain knowledge. So we know all the good players in the industry. We know subsectors of those industries, which we like. And in that way, we feel we can uncover opportunities that maybe others don't see. So that's why our focus is there. But if we see another opportunity either in our portfolio already, which obviously has many advantages because we know that asset or outside, we're very open to consider those as well. So we're not married to investing in health care, luxury or technology. On the U.S. dollar, we don't do any hedging. Hedging, I think, is a useful measure for covering short-term exposures, which you cannot offset for a production company, hedging your fixed cost if you import into a country when your sales and you cannot change your prices. But for us, as a long-term investor, we don't see hedging as a valuable tool. There might be actually a short-term opportunity to say maybe with the devaluation of the U.S. on a relative basis, U.S. companies have become more attractive than 6 months ago. So we look at it more from that perspective. And then utilizing the dry firepower that we have now. We're quite conservative on that and put it in cash spread over euros and dollars across multiple banks, including many of you who are in this call. So stable banks across currencies at a decent return because this is not where we want to make our money. So that's why crypto or Bitcoin would not be places where we would park our money. Where we want to take risk is in the long-term investments that we do and not in the short-term liquidity storage that we hold. So that's how we look at it today and not voicing an opinion on Bitcoin or crypto because there's many people who are much better positioned than I to speak about this. Operator: We will now take the next question from the line of Alberto Villa from Intermonte SIM. Alberto Villa: A couple from my side. Many have been already asked. But again, on Lingotto, congratulations to the team, a very great performance. Now it's 8% of the GAV. Is there any internal limitation you put yourself in terms of size of the investment of your funds in Lingotto or it could grow further in the future? The second question is a more general question is about the -- let's say, when you consider investing in a company with the current geopolitical uncertainty and turmoil, if you're now looking more specifically to some regions rather than others, if there is any, let's say, change in the approach on a geographical standpoint compared to the past due to what has been happening in the recent past and presumably will continue to be a very volatile environment on that side. Guido de Boer: Thank you, Alberto. So on Lingotto, I think the limitation breaks down maybe in 2 parts. One on individual funds and two on allocation to Lingotto in a whole. So as I mentioned earlier on Lingotto as a whole, we always take Lingotto as part of our portfolio review strategy and we see do we want to allocate more to existing strategies or new funds, and we decide what kind of returns, risk, reward do we get against this, and we make an investment decision based on that. In terms of limitation, and I think it's a very important question, which goes to the core of Lingotto. For us, it's key that the investors behind the Lingotto funds focus on performance and outperformance. So the limitation is the size where adding further assets under management would go at the detriment of performance, and that would be the limitation. And that's obviously different for different types of strategies, whether it's public or listed and which markets they are. But that's where the key limitation probably is for individual Lingotto strategies. And then geopolitical, it is an important investment consideration, obviously. It is also a potential opportunity if those have led to significant price movement because we are a long-term investor. So we do take that into account, but I cannot say that, that has led to exclusion of certain regions or countries where we would say we're absolutely not looking there. Operator: [Operator Instructions]. We will now take the next question from the line of Andrea Balloni from Mediobanca. Andrea Balloni: Few questions from myself. My first one is a follow-up to the one of Martino and sorry for asking again, which is about Ferrari. I was wondering if you find some very good opportunities to invest in -- would you even consider another partial disposal of Ferrari to finance the investment? Or on the opposite, the current stake you have in Ferrari is a level you are not willing to lower? And my second question is about current holding discount that we see at 50% despite the material share buyback you have recently done, what could be, in your view, a way to shrink this holding discount as of today? And my very last question is on Philips. I remember when you have announced the acquisition of this stake, you mentioned that you were convinced to be able to extrapolate some value from a company that was clearly undervalued by the market. But just to understand what time horizon you had in mind for this asset? Guido de Boer: Thank you, Andrea. So on Ferrari, our view remains as what we said earlier in the year that our commitment to Ferrari is as strong as ever. And we didn't do this disposal about reducing our interest of the company. It was really a strategic decision to reduce our portfolio concentration as well as creating room for the next opportunity. So we're actually extremely happy that Ferrari is still a significant part of our portfolio. And as I said, we do like concentration and are confident that Ferrari will be a strong contributor to future results. So on the holding discount. What are we doing about it? I think calls like now based on clear and transparent communication are one important part of it. But even more important is we need to continue to show a sustained outperformance, both on an absolute and on a relative basis. And I think it's interesting also to have a look at the long-term performance of Exor versus the MSCI World Index because that's really why we want people to invest in our stock because we are long-term investors and by compounding better returns than the index over a long time, we will create significant value for our shareholders. So that's something we'll just continue to do. But if you have other views of actions that we could take, always happy to hear them from you and either reading it in your report or to have a call on that, if you like. So Philips, we continue to believe that the company has a huge potential and that it's delivering on its potential. So we're quite excited by its operational performance and our conviction also remains strong and happy with the progress that they're making. So our time horizon is long. We're there for the long term. We don't have any specific horizons where we say at this moment, we exit. So there's not a year that I can mention you of our planned horizon for an investment like this. Operator: This concludes the Q&A session. I would like to hand back over to Guido de Boer for closing remarks. Guido de Boer: I would love to thank all of you for your very thoughtful questions. I think this was all valuable and also gives us some good inputs to sharpen our strategy. So very happy you all joined this call, and please reach out via the usual channels, if you have any further information request or I would like to speak to us in any other way. So thank you, everyone, and have a nice day. Operator: Thank you. Ladies and gentlemen, this concludes today's conference call. Thank you for participating. You may now disconnect.
Randall Neely: Good morning, and thank you for attending our midyear 2025 results call. I am joined today by Eddie Ok, our CFO, who will walk through the financial and operations highlights as well as Geoff Probert, our COO, who will provide a review of ongoing operations and provide more detail on the progress made to improve our production sharing contracts in Egypt. In addition, Nathan Piper, Director of Commercial, is also available for the Q&A session. Since myself, the new management team, Geoff, Eddie, Nathan and our entire Board joined the company beginning in 2023, we've made it very clear what our goals were. We intended to improve upon the base business in Egypt, reduce overhead and scale down or eliminate all nonviable activities of the company. To do that, we set out with our JV partner in Egypt, Cheiron to negotiate a new consolidated production sharing contract for the 50-50 jointly held contracts. That has been a major undertaking, and we announced earlier this year that we had achieved a major milestone with the government approval of those terms. Geoff will provide more detail on this process and outcome shortly. For those of you that perhaps have not been paying attention to our journey over the past 2 years, I'll remind you that we have exited all noncore activities, and we reduced our G&A burden by approximately 80%, including our staffing contingent, effectively rightsized the organization. As well, the company returned over $600 million to investors through dividends and share buybacks. Operationally, we have worked very hard to achieve technical alignment with our partner in Egypt, and we are very pleased with how that has progressed. Today, I can confidently state that Capricorn and Cheiron are working synergistically to improve the technical and financial results of the joint venture. When this team, Capricorn 2.0 joined, we all recognized that the company needed to instill financial discipline, which included a measured approach to funding investments in Egypt, effectively a self-funding model. Although with the improved fiscal terms and payment schedules, this approach may not appear as relevant today as it was 2 years ago. We do not intend to deviate from this mindset. With our initial goals principally achieved, we are turning our attention to increasing value for our shareholders. Our intent is to do that through 3 principal activities: First, realizing on the improvement of the base business in Egypt. The improvements to fiscal terms and lengthening of contract life will open up significantly new resource for the joint venture to pursue and exploit. Effectively, the amended contractual terms will allow the joint venture to pursue a very large existing resource base to have both reserves and production. Second, we, led by Nathan, our Director of Commercial, will continue to search for opportunities in the U.K. North Sea to realize on our historic position there. We have a strict set of criteria we measure every North Sea opportunity against. And although we have been deep into several processes, we have been unable to successfully conclude any of them. That's been either due to being outbid or the seller just effectively electing to retain the asset. And the third activity that we'll look to add value is looking for synergistic asset deals or business to add to the portfolio. Ultimately, all of these will lead the company to return value to the shareholders. Building business of scale and longevity. Over the past 2 years, the new Board, myself and the rest of the team have made a major effort to transform the culture, priorities and focus of Capricorn. This wheel is meant to capture very simply how we are approaching this. We focus on the small details. We finance the business and any new ventures conservatively. We approach every project with technical rigor and apply strict capital discipline and demand the same of our partners. We approach the business strictly through a self-funding business model and new ventures initiated will require the application of a prudent approach to risk management. I'll let Geoff take the next slide. Geoffrey Probert: Thanks, Randy, and good morning. You can see here on the graphic that we're on the last step of our journey to completing the consolidation of our 8, 50-50 concession agreements into a single extended and improved agreement. Improvements in concession longevity and fiscal terms are a catalyst to increase Capricorn's reserves and production with value and cash flow enhanced by increased investment self-funded from Egypt. For EGPC, this increased and more importantly, sustained investment delivers great production over the long-term for Egypt, and has potential to be a true win-win for all stakeholders. We continue to expect custom ratification in the near future, commencing investment consistent with the new terms in the second half of 2025 and expect new terms and commitments to apply to that investment. Back to you, Randy. Randall Neely: Thanks, Geoff. Now with many of our primary objectives having been achieved, our primary focus for myself and as well as Nathan is to get investors to recognize this value improvement. On the back of an envelope, you can see that we have a base business in Egypt that fully supports our market value. Note that our debt in Egypt has been paid down materially over this year and will continue to be paid down over the coming year. On top of that, we have the cash that resides in the parent company, a value improvement that will be realized upon ratification of our Egyptian-based business and the value that can be realized by future investment in the U.K. North Sea. All of these combined leave us with a near-term potential of doubling our share value, and that's before we expand our operations either in Egypt or elsewhere. I'll now turn the presentation over to Eddie Ok, our CFO, to provide a review of the financial and operating highlights. Eddie Ok: Thanks, Randy, and good morning, all. Production through the first half was in line with projections, and we continue to guide towards the midpoint of our published range of 17,000 to 21,000 BOE per day. Our focus on higher-margin drilling continues to perform as liquids remain slightly above forecast at 43% of production. OpEx is continuing to trend upwards as the currency devaluation impact from last year works its way through our cost structure. This is being exacerbated by declining production against a large fixed cost base, but we continue to work with the operator to ensure that costs are being controlled to the greatest extent possible. We slightly reduced our capital guidance as scheduling is going to push back some current year activity into the following year, but we remain on track to deliver the bulk of our development drilling in the second half. Next slide, please. As can be seen from our cash waterfall, the contingent consideration collected in the half has offset the slow pace of collections from EGPC. In the second half to date, collections have improved, and we're anticipating the collection of at least $90 million in the second half, which will help offset scheduled repayments of our outstanding debt. Up next, Goeff is going to take you through an operational overview of the remainder of the year. Geoffrey Probert: Thanks, Eddie. I'm going to very briefly highlight our first half 2025 Egypt operational focus, give a snapshot of where we expect to invest in '26 and look at our reserves and resources are trending, particularly in the context of the new agreement. This map shows our focus on liquids development and production, particularly in the BED, Abu Roash G reservoir area, and that was all in the first half of 2025. While new agreement has been finalized, we also drilled 3 wells to fulfill our legacy commitments on the 3 pure exploration concessions acquired as part of the Egypt acquisition in 2021. Those exploration commitments are now satisfied with a minor on spend of $750,000 on NUMB. Our joint venture with Cheiron, the operator has elected to further evaluate commerciality of 2 of these wells, and we expect those results later this month. You can also see here that the hatched areas indicated concessions that we expect to form the new consolidation agreements closely the prime contiguous land added for further development and exploration on trend. Next slide. This slide illustrates our expected 4 rig development drilling schedule, 4 rigs to reflect improved agreement terms encouraging us to invest in a longer list of economic wells. Alongside optimization of development well sequence, we continue to work with our JV partner Cheiron to also prioritize non-rig production generation, reinstating shutting wells, identifying additional perforation opportunities on bypass pay. Next slide. This last slide on reserves encapsulates the rationale behind Capricorn negotiating an extended and improved integrated concession agreement on our 50-50 concessions. We expect our ability to replace reserves and extend their life to be materially improved by the extended concession period and improved concession economic terms. We also expect the concession improvement will also impact our risk appetite to chase near-field exploration potential on our newly extended land and our existing land and to develop and mature our portfolio of resources. Capricorn has been working with opportunity hopper on the 50-50 new concession agreement acreage, not just near-term development options, but also contingent and prospective resources. We expect this work will help to underpin future reserve and resource bookings and may also direct and prioritize productive drilling activity. You can see here that internally, we've identified a working interest around 350 million barrels of oil equivalent unrisked best estimate contingent resources to mature. Near-term license extensions resulting from an approved integrated concession potentially support the early conversion of up to a working interest nearly 20 million barrels oil equivalent to reserves, with further reclassifications anticipated, all underpinned by 5-year investment plans. Once approved, we expect to rapidly move to drill wells to exploit those reserves additions. Thanks for your time and attention. Now I'm passing over to Randy to wrap up. Randall Neely: Yes. Thanks, Goeff. I trust that those of you that have been following the Capricorn story since this team took over will agree that we have had a strong record of delivering on company objectives. To summarize, we set out to improve the Egyptian business by making it both long-term sustainable and a platform for growth. We are very near the confirmation of that objective with ratification occurring in the near future. The new PSC will provide a catalyst for increases in reserves for investment and value improvements. Additionally, we are seeing and hearing reasons to be optimistic about the future reduction of our outstanding receivables and a more stable, consistent payment plan from EGPC. And while we have been slower than we hoped to be to deliver or realize an embedded value for us to reinvest in the U.K. North Sea, we remain steadfast in our goal to achieve this objective. Beyond our current operations in Egypt and our near-term goal of expansion in the U.K. North Sea, we are actively looking for synergistic opportunities in the areas of our capabilities and credibility that we have in Capricorn and our team. Well, that's it for our formal presentation. Thank you very much for dialing in, and we'll now take questions from analysts online. Operator: [Operator Instructions] We now take our first question from James Hosie of Shore Capital. James Hosie: A couple of questions for you. Just firstly, on the improved trade receivable position and the payment plan. You've already received $37 million since the midyear and the release mentioned today a $50 million payment being due in October. Just wondering if it's reasonable to think that Capricorn is on track to collect more in H2 than the minimum $90 million you referred to. And then second question is just wondering about the updated competent persons report you plan to publish once the new concession term is ratified. Should we expect that to include revised 2P production and CapEx profile? Are you simply just going to apply the assumptions you used in July CPR to the new concession terms? Eddie Ok: I'll take the AR question. Yes, you're right. We've received $37 million to date, and we're expecting a $50 million bullet here in the near term. We're remaining conservative about our collections assumptions. But yes, if all goes according to plan, we should be collecting in excess of that with a material reduction in our receivables possible by the end of the year. Geoffrey Probert: And Goeff here, I'll pick up the other question, James, on CPR revision. When we issue that CPR, yes, it will be the midyear actually to understand. It will include revised CapEx profile deductions for production. It will be a full update. Operator: And we'll now move on to our next question from Chris Wheaton of Stifel. Christopher Wheaton: A question for me also on working capital, but trying to look forward a bit further. What provisions in the license renegotiation has there been for working capital recovery? Because my concern when you start drilling and exploiting some of that upside resource potential is, you've got to start really putting CapEx in the ground first, then your production goes up, then you get the cash flow. Well, then you actually sell the oil, then at some point in the future, you get the cash flow. So there could be quite a significant working capital burn at least to start with unless Egypt are prompted in paying those receivables back because with the higher CapEx as well as the higher OpEx, then your receivables amount is going to start building quite quickly unless you get those regular repayments. Could you talk about how you've tried to mitigate those risks in the license renegotiation? And secondly, what that means for potential timing of dividend payouts because I still see your priorities as being first pay down -- first, you've got to keep investing in the drilling. Secondly, you've got to pay down the debt remaining in Egypt and then possibly shareholders could start to get some more cash back. So I'm interested in that implication for your future dividend payments. Eddie Ok: Chris, I'll take that. Yes. So we've got obviously a material investment sort of obligation opportunity in Egypt as a result of the modernized concession agreement and one that we're happy to deliver on given the economic return that's represented by that investment. Just keep in mind, we're still producing 20,000 barrels of oil equivalent per day in Egypt with the corresponding build in cost pools, profit oil, profit gas as well as our existing receivables position. And as you folks have seen historically, we're managing the business quite carefully with respect to invested dollars against realized dollars out. And so that philosophy is not going to change going forward. Part of the overriding imperative on this deal has to be that our shareholders realize a return. Now based off of historical decisions, historical investments, we've got a fairly really weighted debt burden hanging over this asset base. But we plan on honoring those debt commitments with repayments of that debt coming up over the next couple of years as well as delivering on these capital investments. And to your point, yes, after that, and as always, our overriding concern is going to be on shareholder value and how do we deliver that value in the asset base to the shareholders over time. Geoffrey Probert: Jack, I may just add one thing. That is the -- background to negotiations create, let's say, a more investable concession agreement and bond agreements and that creates relevance. I mean the whole purpose is not just to create value for the shareholders also to get paid. By improving the terms, we have an investable set of concessions where before, frankly, that it was a pretty weak place to be. Each we pays those who have the capacity to invest. And by that, I mean the places they can invest economically. So it's a bit of a symbiotic outcome for both we invest, we get great production, we get paid so that we can invest and we generate returns. They do accept that part of it. In terms of the overall commitments we have to make in terms of investment, the terms are -- if you look at our historical investment profile in Egypt on a working interest basis, they're quite modest. It's spread over a number of years -- if there happens to be a short-term problem around payments for a while, we can just dial back investments, while that happens and dial those investments back up again in the future. So we're pretty confident that this structure and the new concession agreement will generate the right opportunities for us to invest and be paid at the same time. Christopher Wheaton: Okay. Just to be clear, the concession doesn't include -- the revised concession agreement doesn't include a sort of contractual basis for this is how receivables will be paid and this is sort of [indiscernible]... Randall Neely: Yes. I'll take it. Yes. So Chris, that's in there already. Like, those terms are in the existing contracts. So... Christopher Wheaton: Right. They are totally fine. Randall Neely: Yes. What the situation is Egypt sometimes struggles to keep up payments just because of their own fiscal issues and where they're prioritized. But we're seeing -- we're seeing that mindset change. And that's because Egypt is short energy and they've struggled to sort of keep the production moving in the right direction given the local demand. And so that's what we're seeing change over the past 18, 24 months as they're moving into more reprioritizing IOC payments in order to at least maintain production rather than things slip off or go to other jurisdictions. Operator: Thank you. We have no further questions in the queue. I'll now hand over for webcast questions. So we've got a few questions from Charlie Sharp at Canaccord. First question, what liquid proportion of total production would you expect to be able to achieve over the next 6 to 18 months? Randall Neely: So actually, I didn't quite hear that. Operator: What liquid portion of total production would you expect to be able to achieve over the next 6 to 18 months? Geoffrey Probert: I don't anticipate a significant change in the overall proportion. We recorded rather a 42%, 43% liquids in the last half, and we anticipate that continuing going forward. It might now just a little bit, but it's not going to increase significantly in the next 6 months. Operator: Next question from Charlie. What sort of test results on the 2 exploration wells would support commerciality and what would the next operational steps to be? Randall Neely: So obviously, the rate and sustainability, so the pressure drop if there is the reservoir during the testing phase there are -- as is often the case in these Western Desert reservoirs or wells, there are multiple potential pay zones. We have to look at productivity, we have to look at sustainability. And we have to look at the distance to the nearest infrastructure. These wells are reasonably close to nearby infrastructure, but that doesn't make them seldom. So yes, that's pretty much how we look at the wells. In terms of the next steps, we take the data, we will evaluate it and with our partner, the operator Cheiron, we'll make a proposal if we see economic value to do so to complete and hook up those wells into nearby production facilities. Operator: Great. And final question, can you provide some guidance on expected year-end 2025 receivables? Eddie Ok: Sure. It's in the release. If you take a look at what our historic production is and the forecast going forward against what our projected collections are that you should be able to back into that number pretty quickly. And like I said, it's going to be a conservative estimate for the year-end, but that's what we're guiding towards. Operator: No further questions from the webcast. So I'll hand over to you for any closing remarks. Randall Neely: Thanks, Kelly. I just want to say thanks, everyone, for dialing in or listening in, afterwards, and we look forward to speaking to many of you live over the coming weeks. Have a great day.
Operator: Good afternoon, everyone, and thank you for participating in today's conference call to discuss Research Solutions' financial and operating results for its fiscal Fourth Quarter and Full Year ended June 30, 2025. As a reminder, this conference is being recorded. I would now like to turn the conference over to your host, Steven Hooser, Investor Relations. Steven Hooser: Thank you, David, and good afternoon, everyone. Thank you for joining us today for the Research Solutions' Fourth Quarter and Full Fiscal Year 2025 Earnings Call. On the call with me today are Roy W. Olivier, President and Chief Executive Officer; Bill Nurthen, Chief Financial Officer; and Josh Nicholson, Chief Strategy Officer. . After the market closed this afternoon, the company issued a press release announcing its results for the fourth quarter and full year [indiscernible] the release is available on the company's website at researchsolutions.com. Before Roy and Bill begin their prepared remarks, I would just like to remind you that some of the statements made during today's call will be forward looking and are made under the Private Securities Litigation Reform Act of 1995. Actual results may differ materially from those expressed or implied due to a variety of factors. We refer you to Research Solutions' recent filings with the SEC for a more detailed discussion of the risks that could impact the company's future operating results and financial condition. Also, on today's call, management will reference certain non-GAAP financial measures, which we believe provide useful information for investors. A reconciliation of those measures to GAAP measures is included in the earnings press release issued this afternoon. Finally, I would like to remind everyone that this call will be recorded and made available for replay via the company's investor relations website. I would now like to turn the call over to Roy W. Olivier, Roy? Roy Olivier: Thank you, Steven. Good afternoon, and warm thanks for joining us. Overall, we're pleased with the progress of business in FY '25. We set many new records for the company's performance, including $21 million in ARR we grew ARR 20% in FY '25 and remain focused on hitting our $30 million platform ARR target by the end of FY '27 this is not guidance, but a BHAG or a Big Hairy Audacious Goal. Our acquisition pipeline is strong, and we have several opportunities that we believe would allow us to hit that goal faster. To do that, we need to execute well on several fronts. First, we need to execute from a product perspective in terms of providing unique value delivered at the right time in the customer journey. Much of this involves development of our existing products and expanding how AI can help researchers accelerate research in a copyright compliant way. While we can always improve, we continue to make good progress in this area. Second, we need to continue to execute in our marketing and sales teams. Market has done a great job in building top of funnel leads through marketing activities, including digital spend, webinars, white pay more, we see strong results in this area. As you know, we brought a new Chief Revenue Officer in November of 2024 and have seen strong B2B sales in the second half of the year. We expect that to continue in FY '26. Third, we seek organically and through acquisitions, unique value that can be software tools, content or a combination of content that we believe are not only unique today but will remain unique in the AI world. We'll discuss this a bit later in the call in terms of how we think about our strategy going forward. Finally and most importantly, we need to have the right strategy. We have been a company in transition from a transaction-based company into a vertical SaaS company for many years. We are now in what may turn out to be a period that will drive massive change in the segments we serve due to the MPI will have on research workflows. Over the past several years, we have built a great set of software and other research tools to support research. As we look forward, large LOMs have the potential to drive massive change to research workflows so we must pivot our strategy to be where the customer is and deliver unique value at the right time, at the right place in the research workflow. In short, we will continue to improve software tools for our customers to simplify and accelerate the research process, but we will also need to improve our software APIs and create new AI-based solutions to support larger customers who will standardize on one LLM but need some unique value data that we can provide. Our AI-based products are organically growing at almost 4x the pace of our legacy products today. We expect to see strong tailwinds from AI in the next few quarters, and we think we are uniquely positioned to take advantage of that as we update and expand our products. Josh Nicholson will provide some context about that. updated strategy later in the call. For now, I'd like to pass the call over to Bill to walk through our fiscal fourth quarter and full year 2025 financial results in detail, and then I'll come back with some additional comments. Bill? . William Nurthen: Thank you, Roy, and good afternoon, everyone. I will start by first summarizing the fourth quarter results, and then we'll discuss the full fiscal year results. Please note for comparisons between the fourth quarter 2025 in the fourth quarter of 2024, those comparisons are fully organic. For fiscal year 2025, the results include 12 months of contribution from the site acquisition compared to approximately 7 months in fiscal year 2024. The fourth quarter was another really strong quarter for our business and served as further validation of how our ongoing shift to SaaS revenue is translating into expanding margins, profitability and cash flow. Total revenue for the fourth quarter of fiscal 2025 was $12.4 million compared to $12.1 million in the fourth quarter of fiscal 2024. Our platform subscription revenue increased 21% from the prior year quarter to approximately $5.2 million. The growth was primarily driven by growth in both B2C and B2B platform revenue including for the latter, a net increase of platform deployments and upsells and cross-sells into existing customers. As a mix of total revenue, platform revenue accounted for over 40% of the revenue in the quarter for the first time at 42% compared to 35% in the prior year quarter. We ended the quarter with $20.9 million in annual recurring revenue, or ARR, up 20% year-over-year. The result included another impressive quarter of B2B ARR growth. You may recall that in our last quarter's call. I commented that net ARR growth in Q3 was a company organic record of $736,000, this quarter was very close to that result as net B2B ARR growth was $724,000, which compares to $407,000 in the prior year quarter. We also added 38 net new platform deployments. The last quarter, the growth was well balanced between new sales and upsells and occurred across both Site and Article Galaxy products. The total company ARR at quarter end breaks down as $14.2 million in B2B ARR and approximately $6.7 million in normalized ARR associated with sites B2C subscribers. We did experience a modest sequential decline in B2C ARR as the late spring into summer is seasonally a difficult time for that product. As a result, the net total incremental ARR growth for the quarter was approximately $567,000. We see today's press release for how we define and use annual recurring revenue and other non-GAAP items. Transaction revenue for the fourth quarter was approximately $7.3 million compared to $7.9 million in the prior year quarter. We started seeing some year-over-year declines in paid transaction order volumes in February of 2025 and that trend continued through our fourth quarter. Our total active customer count for the quarter was 1,338 compared to 1,398 in the same period a year ago. Gross margin for the fourth quarter was 51% a 450 basis point improvement over the fourth quarter of 2024. This was the first time in the company's history that blended gross margin has been in excess of 50% for a quarter and platform gross profit contributed over 70% of the total gross profit in the quarter. The platform business recorded a gross margin of 88.5% compared to 85.3% in the prior year quarter. This was an unusually high result and I suspect it could come down some in future quarters, but not materially. Gross margin in our Transaction business was 24.1% compared to 25.4% in the prior year quarter. The decrease was primarily attributable to lower fixed cost coverage due to the lower revenue base. I expect transaction gross margins to look more like this quarter's result in future quarters, should we continue to experience similar year-over-year declines in transaction revenue. Total operating expenses in the quarter were $5.1 million compared to $5 million in the prior year quarter as increased sales and marketing expenses and general and administrative expenses were partially offset by lower stock compensation costs. I will comment that while sales and marketing expenses were up year-over-year, they were down sequentially. This is due to some seasonality we have in our accruals that typically produce a sequential reduction in sales and marketing expense between Q3 and Q4. As a result, I expect sales and marketing expense to look more like what we saw in the third quarter of 2025 as we look ahead to future quarters. Lastly, the Q4 result for general and administrative expenses did include over $100,000 in severance-related charges that were accrued at year-end. Other income for the quarter was $1.2 million and was primarily attributable to a favorable adjustment to the final earnout determination per site. Other expenses for the prior year quarter totaled $3.5 million, which included a $4.3 million charge related to an earn-out adjustment in that period per site. Net income for the quarter was $2.4 million or $0.07 per diluted share compared to a net loss of $2.8 million or $0.09 per diluted share in the prior year quarter. Adjusted EBITDA for the quarter was $1.6 million, which was a 13% margin and a new company quarterly record compared to $1.4 million in the fourth quarter of last year. Now let me turn to our results for the full fiscal year 2025, which was also another record year for the company in many respects. Total revenue for fiscal 2025 was approximately $49.1 million, a 10% increase from fiscal 2024. Platform subscription revenue increased 36% to roughly $19 million. From an ARR perspective, we added over $2.1 million in net B2B ARR for the fiscal year. And total deployments ended the year at 1,171, up 150 for the year. Net B2C ARR increased just under $1.4 million for the year. Transaction revenue for fiscal 2025 was $30.1 million, a 2% decrease from the prior year. The decrease, as previously mentioned, is attributable to the declines in order volumes we experienced in the second half of the fiscal year. Gross margin for fiscal 2025 was 49.3%, a 530 basis point improvement over fiscal 2024. The result represents a 23% year-over-year increase in the company's gross profit. Total operating expenses in fiscal 2025 were $21.7 million compared to $20.4 million in the prior year. The increase is attributable to higher sales and marketing expenses, offset by lower general and administrative expense and lower stock compensation expense. We intentionally invested in sales and marketing expenses in fiscal 2025 and believe we are seeing some of that pay off with the recent quarterly performance in net B2B ARR growth. Other expense for the year was $1.2 million compared to other expense of $2.9 million in fiscal 2024. And -- both years reflect net adjustments -- net expense adjustments of $1.7 million and $5.1 million, respectively, made related to the site earn-out. Net income for fiscal 2025 was $1.3 million or $0.04 per diluted share compared to a net loss of $3.8 million or $0.13 per diluted share in the prior year. Adjusted EBITDA for the year was $5.3 million, a company record compared to $2.2 million in fiscal 2024. It also represents the first time in the company's history that full fiscal year's adjusted EBITDA margin crossed the 10% threshold. Before I discuss cash flow on our balance sheet, I would like to take a minute to discuss the final determination of the site earn-out. The final earn-out was determined to be $15.4 million. This was to be paid 50% in cash and 50% in stock over 8 quarters. However, through an offer to site shareholders, we increased the cash mix portion of the earn-out payment to approximately 62%. We made this offer given the confidence we have in our cash flow and the desire to issue less shares as part of the overall transaction purchase price. We made the first payment on the earnout in August, which consisted of approximately $1.3 million in cash and approximately 265,000 shares. Future cash payments will be approximately $1.2 million each quarter and the shares to be issued will change quarterly based on a market calculation of their value prior to the distribution of the shares. The payments will be every 3 months and will be completed in May 2027. Turning to cash flow. It has been very satisfying to see the transformation in cash flow in the business over the past few years. Our cash flow has continued to outperform our adjusted EBITDA which I think is a testament to the quality of our earnings and the validity of our SaaS revenue mix shift model. In fiscal 2025, we generated over $7 million in cash flow from operations which has almost double the result from the last year of approximately $3.6 million. This cash flow has translated into a nice cash build on our balance sheet. I'll remind everyone that when we completed the site acquisition in December 2023, our cash balance dropped to $2.7 million. Now only 18 months later, we were able to end fiscal year 2025 with a cash balance of $12.2 million, and there are no outstanding borrowings under our $500,000 revolving line of credit. As a result, barring any strategic M&A-type activities, we expect that we can make the site earn-out payments in fiscal year 2026 and still end the year with a higher cash balance than we have today. As we look ahead, we are enthusiastic about the momentum in our B2B ARR growth and believe that can continue. There are some competitive pressures we are experiencing in the B2C space that may affect near-term growth, but we remain positive regarding the long-term prospects for that business as well as our ability to convert certain groups of B2C users to larger B2B platform sales. Lastly, transaction revenue growth was challenging in the back half of fiscal 2025. We expect it to continue to be challenging in the first half of fiscal year 2026, but are optimistic about a flattening of the decline or even a possibility of a return to low levels of growth as we get into the back half of fiscal 2026. From an expense standpoint, we will continue to invest in sales and marketing as well as in technology and product development, while aiming to reduce our overall general and administrative. From an adjusted EBITDA perspective, I expect to follow the same seasonality as last year with the first quarter being potentially a slight dip sequentially from this quarter, but a beat to last year's Q1 result. Q2 will likely be our weakest quarter and then our strongest quarters will be in the back half of the year. All things considered, we remain on track to have another record year of performance. Further, our present cash balance, paired with our expanding adjusted EBITDA and cash flow, leave us better positioned than ever to execute on M&A opportunities. I'll now turn the call back over to Roy. Roy Olivier: Thanks, Bill. A few additional comments about our FY '25 results. As a reminder, we made several investments during the year, some of which are, we invested in a new Chief Revenue Officer, who joined in November of '24 and has overhauled the way we go to market. These changes have driven nice results in the second half of the year, and we expect to continue to see that in FY '26. As a result of his efforts, we have signed more large contracts in recent months, including several over $100,000 in ARR than we've closed in the company's history. We've also seen strong results from the new academic focused sales team we formed in early FY '25. It's our fastest-growing segment and generated new bookings equal to the long-standing corporate focused team. That said, our business remains 80-plus percent corporate customers. We made a change in leadership over our transactions business. As previously noted, that business has seen headwinds, but we have some levers we can pull to improve results. The new team is aggressively evaluating ways to do that and working with our product management and software engineering teams to implement those improvements. We have seen some short-term successes and we'll report more in our Q1 call. We've also made several changes to the software engineering and software development teams over the year. We believe those changes will accelerate development velocity, and provide more high-value features to our customers as we go through FY '26. We revamped how we identify and pursue acquisition targets, as a result of the changes we made, we have a large pipeline in place today. The targets we have are actionable, meaning valuation expectations seem realistic and add new workflows or content that we believe will fit well into our customer base. In addition, we believe our products are fit into their customer base. I'm confident we'll be able to move forward with one or more deals in FY '26. In addition, given our strong cash generation, I believe we can finance those deals primarily through senior debt and cash. I have a strong bias towards sellers who want to stay with the company and grow the combined business and want stock to do so. However, I expect deal structures will be more weighted toward cash at close. We also invested resources in time to create a new source of revenue with the recently announced AI rights product. Every customer of ours is concerned about copyright compliance and wants to make sure they have the rights they need when they need them. The best example of that recently is AI rights. Our solution allows the customer to know what rights they have in a single click and acquire rights as needed. It allows the customer to use AI, provides new revenue source to the publishers and add real value to our product. It's been very well received by customers and our publishing partners, including some of our largest customers. I've got a few more comments about the future, but right now, I'd like to pass it over to Josh, our Chief Strategy Officer, to walk you through some of the things we're doing to drive growth in this new AI-driven world. Josh? Josh Nicholson: Thanks, Roy, and hello, everyone. Today, I'd like to highlight some of the broader shifts we're seeing across the web with the rise of LLM and chat bots and how these changes are creating new challenges as well as opportunities for us. Increasingly, more people are performing what the Wall Street Journal called zero-click search, that is people are turning to AI as answer engines and getting good enough answers without having to click through to the underlying data, whether that is a news article or Reddit thread or in our case, a scientific article. As Roy and Bill have highlighted, this is manifesting on our side with [indiscernible] transaction revenue slipping and publishing partners reporting declines in traditional usage-based statistics such as full text reads and downloads. . Our internal surveys from users point specifically to AI being the reason people are acquiring less articles. In short, AI is shifting demand from article retrieval to structured reasoning, which means the future of research and our products must be task and databased. Over the last few calls, I've highlighted how our AI strategy is to focus on specific researcher based workflows with AI, differentiating ourselves from more general tools by focusing on the first and last mile of the researcher journey, something that might be too small or too complex for a generic tool to accomplish. We will continue to focus on specific researcher needs as we develop our products and go-to-market approach, but we will also increasingly look to be where the customer is or what we call a headless strategy. We see site and article galaxy increasingly being used as an API-first platform. Our customers are no longer just logging into a single interface. They are embedding site directly into their own systems, dashboards and even generative AI assistance. This headless strategy is intentional by decoupling our services from a fixed UI, we enable developers and institutions to full citation graph, evidence summaries and right cleared full text content directly into their workflow. Already, we have deployed various API first deals across both products, some of which have been our largest contracts ever for our respective product site in Article Galaxy. This approach allows us to go where the user is through integrations into internal built tools, third-party products and to shift our focus from an arm's race to an ARM supplier. We have launched an AI TDM rights offering that allows our customers to easily and securely get AI rights for articles they have acquired. And while many publishers might negotiate these rights directly, it's important for us to display that information for our users and to make it possible to acquire the rights where necessary. Closely tied to this, we are exploring working directly with publishers to enable AI models and agents to discover content and source AI rights from a single pan publisher resource called an MCP or Model Context Protocol. We believe such infrastructure is the future of how large language models interact with research articles, presenting the path for AI models to securely clear scientific articles, retreat citations, verify claims and integrate trustworthy literature directly into its reasoning process. In practice, this means that whether you're a pharmaceutical company building an in-house assistant and academic using a generic AI your company has licensed or a publisher enabling AI-driven services Research Solutions becomes the compliant safe bridge between proprietary content, licensing and reliable AI output. Taken together, these initiatives mean Research Solutions is no longer just a distributor of articles or a platform for positioning ourselves as the building blocks of scientific AI, the infrastructure that ensures research content is accessible, reliable and legally cleared for the age of generative AI. I'm excited by our progress as a team and I think we're uniquely positioned to serve the needs of publishers and researchers in an AI-native world. Thank you again, and I'll now turn it back to Roy to wrap up. Roy Olivier: Thanks Josh, I mentioned in my introductory comments, the things we need to execute on in FY '26 and beyond. The most important one of those things is strategy. We have spent a lot of time in FY '25 looking over -- looking -- thinking about all the different things we do and what we might do that is unique. A few of those things are managing the customer's library of scientific research, including what rights came with those articles, the ability to easily access rights the customer needs when they need it. The site badge, which is like a FICO score or Rotten Tomato score for an article being evaluated and that is unique in the market today. The site search, which includes searching beyond the paywall for most of the world's content. This generates better results, is copyright compliant and actually improved sales of articles for the publisher. Generally, the large LLM search abstracts and have near 0 behind the paywall access. Because of all of this, site generates far fewer hallucinations in its results. We also deliver articles from 2,000-plus publishers, a vast majority of those are delivered in a few seconds. And we integrate curated data from several sources to improve AI-generated output. We have the ability to do that today given the databases we acquired as part of the Resolute acquisition. That is a big part of our headless strategy because it will offer our customers curated databases to include insights assistant or other AI-generated output. . In short, I think we're on the right track in terms of an updated strategy that will position us well in the new AI world. We also think the operational improvements and investments mentioned above will enable us to execute that strategy, both organically and through acquisitions. One final comment. I did mention in the pre-release of our earnings back in August, that we were focused -- or that we continue to be focused on the weighted rule of 40. We -- in FY '25, the calculation was a 34 in the rule of 40, and as we think about our FY '26, we expect to make continued progress toward the 40 number. Just to -- as a reminder, the weighted rule of 40 is your ARR growth rate as a percentage times 1.33 plus our adjusted EBITDA margin as a percentage times 0.67. So with a little more weighting on growth, we continue to lean toward investing in growth to make it to the weighted rule of 40. After all that, we remain excited about where we are, how we're positioned and where we're going. And I'd like to turn the call back over to the operator for questions. Operator? Operator: [Operator Instructions] We'll take our first question from Jacob Stephan with Lake Street. Jacob Stephan: Maybe just first, wondering if you could touch on the nice sequential uptick in ASP. Maybe help us kind of think through some of the drivers of this? Was it more cross-sell, upsells or kind of larger new deal activity? Roy Olivier: Bill, do you want to take that one? William Nurthen: Yes, sure. No, we are -- I mean, part of what we've seen with the onboarding of the new CRO and some of the sales training that we've been doing is that we are actually getting larger deals. And so I think Roy mentioned we had -- we've got announced just recently a couple of hundred thousand dollar deals in. And these are in the past few months, we've seen some of the larger deals in our company's history. I'll also say there was sort of a period where we had some churn from Resolute in the past, which was traditionally more of a larger deal where that basically caused a decline in our ASP. And so that has kind of leaned off and now we're at a place where we can sort of build back ASP. And I think it will be a focus as we do additional sales training, bring on some better salespeople over time and again, continue to see some larger deals. Also just as it relates to some of the API type deals that Josh was talking about. Jacob Stephan: Okay. Got it. And you kind of ask one question further on Resolute. Obviously, you noted some churn issues kind of starting off there. But how are you using the product? How do you see the Resolute software adapting to your new strategy of being the API provider for LLMs? Roy Olivier: Well, Resolute has always had a strong API and has not necessarily had a strong UI in their software. So Resolute works much better in this headless strategy than it works as a product unless we go in and rewrite big parts of the product. which we have not wanted to do. So we haven't talked about Resolute in a number of quarters because it's a product we don't focus on. We focus on a heavy investment in site and heavy investment in Article Galaxy, which, of course, are driving all of our growth. However, as we develop this headless strategy we talked about, being able to plug in the 13 additional databases via API into the workflow kind of resurrected that product in terms of selling that data to customers. And Josh, you may have a few other comments on that. Go ahead, if you do Josh Nicholson: Yes. I'd really just emphasize that there are these 13 highly curated databases kind of coming to us for an API to get and access to the article, to get clinical trials, to get research articles, to get news articles, all these different things is a big value add for customers. And so I'm personally excited because it's kind of been right there in front of us for a while, and it's very easy to execute on. The one thing I would also say about the API-first deals is that by embedding ourselves into the infrastructure of some of these large companies, I think those contracts become very sticky. And so I'm personally quite excited by the Resolute databases really coming back to life as a focus for us. Jacob Stephan: Okay. Maybe just one last one, more on the kind of competitive environment in this headless strategy. Are you aware of anybody else that's kind of doing -- running the same API strategy to kind of plug in with the larger LLMs? Roy Olivier: Do you want to take that, Josh? Josh Nicholson: Yes. I think I think what we're starting to see in the ecosystem is some publishers doing this. And so if you look at why we, I think the third largest publisher, they are directly opening up their articles or segments of their articles to LLM providers such as Anthropic. On their recent earnings call, they talked about leaning more into AI and specifically AI licensing deals. And so I think we're going to start to see this across the ecosystem from publishers themselves. I think publishers will have somewhat of a challenge becoming a pan-publisher source for this, largely because competitors don't want to give their content to other competitors. And so this is what we're talking about when we say we're pretty uniquely positioned is that we work with virtually all publishers. We're already driving them revenue. And this is really, as Roy and I have said in the past, kind of a shift from [indiscernible] . And so I increasingly see these bits of articles or chunks of articles and specifically the data from articles being something that's valuable that integrates directly into tools, whether that's a hyperscaler or whether that's an internally licensed LLM at a large corporate or even an academic institution. So I think it's an exciting time, and I think there's a lot of people kind of looking at this and trying to say, how do we bridge this gap between research articles and AI. Operator: We'll take our next question from Richard Baldry with ROTH Capital. Richard Baldry: Same question I asked last quarter, the COGS line was actually slightly down on the platform side, while revenues were up pretty good. Can you talk again about sort of the trends there, whether this is sort of getting the peak optimization, I think about it that way? Or is there further cost improvements that can come on the platform side even as the top line is scaling? Roy Olivier: Bill, do you want to take that? William Nurthen: Yes, sure. Yes, some of this is effectively using our cash. I mean really where this is coming from is we sort of stabilized the labor base there that grows kind of just was like not a lot of additional headcount, but just cost of living increases, things like that. But we've really tried where we could to lower or limit the increase in the hosting cost. And some of what we've been able to do is take the cash flow that we've had and apply that to some prepayments where we prepay some of our space with Amazon Web Services and other providers. And as a result, we're actually getting it cheaper over time by prepaying. So I'm not sure how much we can do that going forward to sort of see it decrease, but I think we can do that to the extent that it will increase less than at the pace that we're growing the revenue, which again is why I think you're seeing some very high numbers on the gross margin side for platforms. We're also seeing in certain areas, AI becoming cheaper, so as we grow, some of the AI providers we use get cheaper over time. And so that's impacting the number as well. Richard Baldry: Okay. Then on the AI-related deals being 4x the growth rate of non-AI, do you think that can continue at this pace? Is there sort of eventually the scale of that base gets big enough that it can't keep up at that sort of delta? How do we think about that headed into the next sort of year or 2 as a driver? Roy Olivier: Yes. I think we expect to see similar results in the B2B space. In the B2C space, we don't expect it to grow as much as it did in FY '25 simply because the base is getting bigger and it is getting more competitive. But Josh or Bill, I'd invite you to add any comments you might have. Josh Nicholson: Yes. I mean I would just again emphasize I think with this headless strategy, this is internal tools or internal companies using internal AI and this allows us to price based on like the usage of this, right, the calls that they're making to our API. And so what we're seeing is as these tools ramp up, it's less looking at here's a 100-person seat license versus here's a company-wide integration into a tool that they're heavily training on. And so I think that will command larger check sizes at B2B. And I think as we started to prove that out, those will continue to grow because we're going into places that companies are already investing a lot of money into. Richard Baldry: Great. And last for me would be, can we dig a little deeper into the strength in the deals above $100,000? So are you going after a different type of customer? Or are you going after a different value prop? Are they larger deals per customer? And how are you achieving that on sort of a similar customer base? Or is it different verticals? How are you getting sort of larger deals out of what presumably is a similar customer set? Roy Olivier: Yes, there's a few moving parts. One is the new sales process and the new CRO has brought in a number of new people who are not kind of preprogrammed with an expectation of what we should sell a product at. And a big part of the new sales process is spending time qualifying the customer and understanding what their pain points are, what value we can use to address those pain points and what the economic impact to them will be if we do. And then the products are being priced accordingly. So I think part of it is -- and I think it's probably a big part of it is sales execution and the way we're selling now. Secondarily, we did wholesale change the pricing on the academic segment of the business, not much of that is reflected in FY '25. But what we did do in '25 is we experimented with different pricing points. In other words, when we acquired site, they had a fairly set pricing model for libraries. We sold at that price point. We sold at price points way above that price point, and we kind of played around with pricing in FY '25 until we figured out a new model that we recently implemented. So some of it is just our standard pricing has changed. And I guess that would be the 2 main drivers that I can think of. Bill, is there any more that you can comment on? William Nurthen: Not too much. I do think it's a sales execution thing. And really, before we frame a proposal to a customer, really trying to understand their pain points and how much value the product is going to deliver for them and then pricing that value accordingly. Operator: [Operator Instructions] We'll take our next question from Derek Greenberg with Maxim Group. Derek Greenberg: The first question I have is just on a recent partnership you guys announced with LibKey and the integration there. I was wondering if you could just talk a little bit more about this partnership and the opportunity there. Roy Olivier: Yes. As that address -- I'll jump in and Josh, you can add some comments. But basically, in the academic segment, LibKey is a big player in the library, providing a product that's called a Link Resolver. And Link Resolver, what it basically does is when you do a search and you get an answer to your search in terms of a scientific article, it kind of resolves where you go to get to the link to obtain that article. And they've been doing that for a number of years, private company successful. And we also work with, frankly, 3 other link resolver companies that we worked with for a number of years. And so putting together the Third Iron deal, Third Iron is the company that owns and -- I'm sorry, the LibKey product. We've run a number of webinars in conjunction with them, which introduce us into their libraries. And keep in mind, academics is new to us. I don't think we have more than 200 academic customers. There are 10,000-plus libraries out there that we can sell into. So we view partnering with Third Iron around LibKey as an opportunity to expand our academic business as well as kind of revisiting the partnerships we have with some other providers that provide a product like LibKey to expand into their academic library business. Josh, anything you want to add? Josh Nicholson: I don't have too much to add except to say that we look at a variety of different services that Roy mentioned to get our users access, whether that's subscription-based access that they have from their university or whether they're an individual at a university, access to the content as quickly as possible. And so there's really kind of like a hierarchy of needs and looking at how can we make sure we're facilitating access for the end user in the most robust and kind of efficient way possible. And I think leveraging our partnership with LibKey is one piece of that. Derek Greenberg: Okay. Got it. Turning to the cross-sell between Site and Article Galaxy. I was wondering if you have any statistics you're willing to provide in terms of what percent of Article Galaxy customers are also customers of Site. I recall previously, you said this was single digits and you were looking to get to double digits. I was just wondering how things are progressing on that side. Roy Olivier: Yes. We have not disclosed that number. I can tell you that -- and Bill, correct me if I'm wrong, a vast majority of the site sales in FY '25 are to what we call a new, new customer. In other words, we're not doing business with them on the Article Galaxy side. We do some cross-sells and a lot of times, those cross-sells are pretty big from an ARR perspective. But I think if you look at it from a logo perspective, vast majority of the logos are new, new customers. Bill, anything to correct that? William Nurthen: Yes. I would still describe it, excuse me, as low to mid-single-digit penetration on the Article Galaxy customer base. Derek Greenberg: Okay. That's helpful. My last question is just on margins. We saw some really good improvement this year. EBITDA margins growing 5%, doubling year-over-year. I was wondering, looking towards '26, how we see expansion relative to this year in margins and how you expect, I guess, operating expenses to grow compared to revenue? Roy Olivier: Bill? William Nurthen: Yes. I think part of the question for us is how much do we invest back into sales and marketing and tech and product development. As I said, we're trying to basically try to keep investing in the sort of those 2 top lines on our expense base, sales and marketing, tech product development while cutting sales -- excuse me, cutting G&A, things like stock comp where we can. But I will say -- so in other words, I think we'll definitely cross the 10% margin threshold for the year. We want to stay above that. I think next year, we can be above where we are today, but we may temper that a bit. In other words, I think we could run 15 plus, but I don't think we're going to do that. I think we'll invest back into it. And so we'll kind of be somewhere in between that kind of 10% to 15% range, and that's where I expect we'll kind of end up from an EBITDA margin. I think gross margin will continue to expand. That will be 50%-plus for the year next year. And expense base, tough to say. I mean, again, I think it could -- we'll kind of pull levers where we need to pull levers. But again, could be 10% growth on the sort of SG&A type bucket. But again, I think I'll have more update on the Q1 call as we see our Q1 results come in and as we sort of further define and chart out how we're going to manage expenses and invest in growth for the rest of the year. I do think transactions are a key element of this. And on our own internal models, as I said, we're modeling those down at least for the first half of the year. And so if you are sort of building models and such, I would do similar from that standpoint until we start to see that turn the other way. But given that, I still think we'll be kind of at the levels I talked about as we look ahead to '26. Roy Olivier: I did get one question via e-mail. Can we explain the strategy to stem the decline and resume growth in the transactions business? To address that, what I would say is the current thinking is product improvement to improve conversion percentages. And I think part B of that is understanding what's driving the change. In other words, we're seeing a significant year-over-year increase in monthly average users and weekly average users which is great. But what we're seeing is a big increase in them acquiring free documents and not paying for documents. As Josh mentioned, we recently did a survey that suggested some of our customers, around 10%-ish of our customers are buying less documents because they can get a good enough answer from AI. So our current thinking is to improve -- we have a massive amount of traffic in site, and we have a massive amount of traffic in Article Galaxy. And so our current thinking is to work to make -- to improve the conversion rate to also take advantage of the opportunity, you just bought this article, here's 3 other articles like it. You just bought this article, here's 5 articles that have a supporting statement in them related to the one you acquired or have a contrasting statement in them related to the one that you acquired. Do you want to buy these? So it's really -- I use the comment internally, we want to be the Amazon of Docdel. We want to make it super easy. It's not as easy as it could be today. We want to suggest it sell. We don't really do that today at all and do some other things. As I mentioned, we already took action on one barrier and saw a pretty nice improvement, which if it were to continue for all 52 weeks because we look at weekly data, would be a high 6-figure improvement in revenue to that business. And as you know, that's a pretty EBITDA profitable business for us. So we've got a number of things in the works, but strategically, we focus on SaaS revenue and AI, but we do have a fairly large around 60 people that work on the Docdel business. The leader in that business now is a guy who's very technologically savvy, and he's gone through every internal process, every customer process that we have with the intent of how do we make this more seamless and more suggestive to drive more sales in that business. Back to you, operator. Operator: And there are no further questions on the phone line at this time. So I'll turn the program back to you, Roy, for any additional or closing remarks. Roy Olivier: Okay. Well, thanks, everybody, for your time, and I look forward to connecting in November to discuss our first quarter fiscal 2026 results. Have a great day. Operator: This does conclude the Research Solutions fiscal and operating results for its fiscal fourth quarter and full year ended June 30, 2025. Thank you for your participation, and you may disconnect at this time.
Jeremy Szafron joins Kitco News as an anchor and producer from Kitco's Vancouver bureau. Jeremy is a seasoned journalist with a diverse background covering entertainment, current affairs and finance.
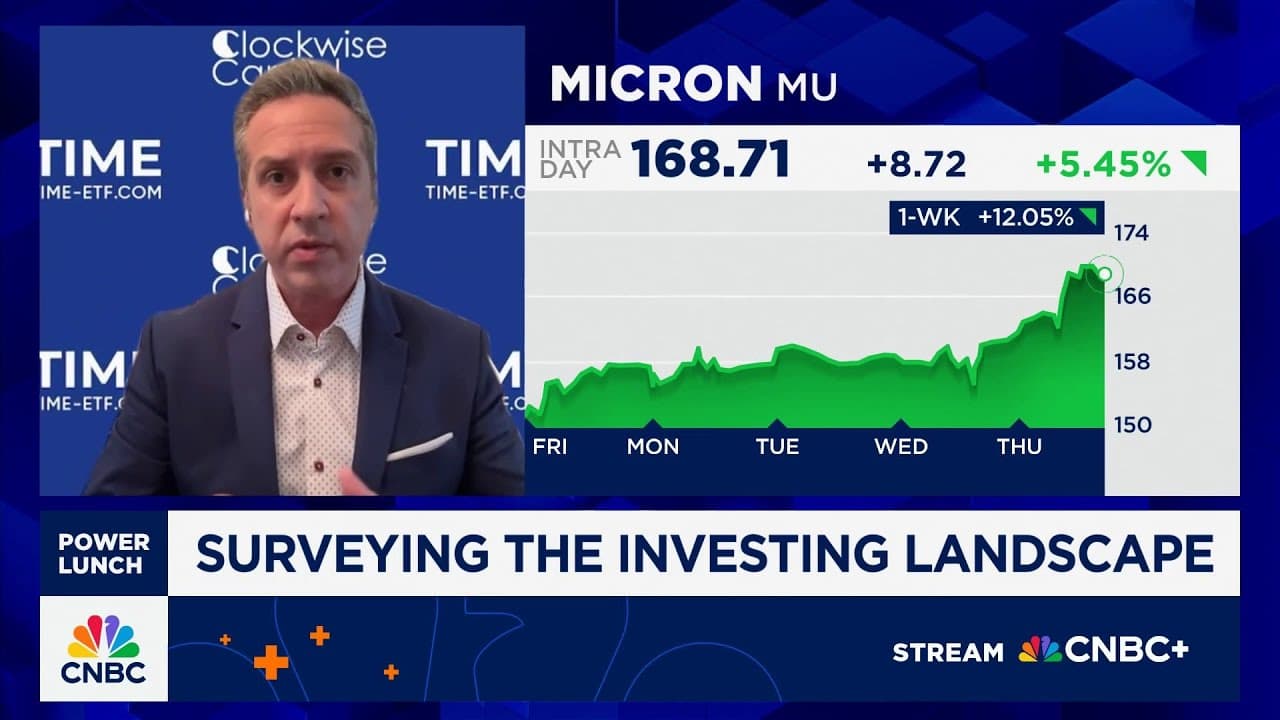
James Cakmak, Clockwise Capital management CIO, joins CNBC's 'Power Lunch' to discuss market outlooks, tech names he's keeping an eye on, and much more.
Joseph Lavorgna, U.S. Treasury Department counselor to the Secretary, joins CNBC's 'Power Lunch' to discuss rate outlooks.
Plus, the risks that could force the Fed to shift its focus from a softening job market back to sticky inflation.
The S&P 500 Index didn't fight the Fed after the U.S. central bank lowered interest rates by a quarter-point on Wednesday.
Does the cost of producing information outweigh the benefits? Using Robert Shiller's long-run data, this post shows that quarterly earnings contain information that is likely valuable to both long-term allocators and short-term traders.

Billionaire investor David Tepper thinks stocks are considerably overvalued, but remains in the market because his number one rule is to never fight the Federal Reserve.
Brian Stutland, chief investment officer at Equity Armor Investments, joins CNBC's 'Power Lunch' to discuss market outlooks.
Tom Lee, Fundstrat head of research, joins CNBC's 'Power Lunch' to discuss market outlooks, how much the Fed matters to equity markets, and much more.

The rally from the September 2 low will ideally reach about 24770 but could go up to 25570. A roughly 5% correction should then occur before the index is ready to rally to 26,000+.
The Federal Reserve cut rates by 25 basis points, signaling a shift toward neutral policy as labor market risks rise over inflation concerns. Treasury yields above 4% make the 10-year note attractive, especially if labor market weakness leads to disinflation and further rate cuts.